Deep Dive SSRS Reporting from the Beginning

Why take this course?
🌟 Master Microsoft SQL Server Reporting Services (SSRS) with Real-World Examples! 🌟
Course Headline: 🚀 Real World Development Examples & Tricks of Microsoft SQL Server Reporting Services Reports using Visual Studio (SSDT) 🚀
Deep Dive SSRS Reporting from the Beginning: Join us on a comprehensive journey through the world of SSRS Reporting, leveraging the power of Visual Studio (2017 or SQL Server Data Tools) to create robust and insightful reports. This online Microsoft SSRS Tutorial is your stepping stone to handle real-world reporting scenarios with ease!
Course Overview:
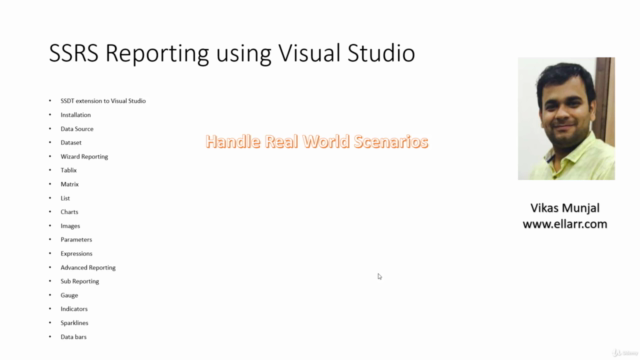
This course is a complete guide to SSRS Reporting, covering all the essentials from the ground up. You'll master everything from setting up DataSources and Datasets to crafting complex Tablix reports, implementing grouping, and manipulating data with calculated fields and advanced expressions. Let's dive into what you'll learn:
SSRS Reporting Process:
- Shared and Embedded DataSource and DataSet: Learn to connect and manage your data efficiently.
- Report Generation using Report Wizard: Start with the basics of report generation and evolve your skills.
- SSDT Components Explained: Understand the tools at your disposal within Visual Studio.
- DataSet used in SSRS Reporting Explained: Discover how to effectively use Datasets in your reports.
- Tablix Report: Learn the ins and outs of creating versatile Tablix reports.
- SSRS Grouping: Understand how to organize data into meaningful groups.
- Black and White Report: Find out when a monochrome report might be the best choice.
- DrillDown Option: Add interactive elements to your reports for deeper analysis.
- Page Break in SSRS: Master the art of controlling page layout.
- Merge and Sort a column based on another column: Learn to sort data dynamically.
- Add Calculated Field: Enhance your reports with custom calculations.
- Display loss in Red Color: Visualize financial data with impactful color coding.
- Advantage of Creating Calculated Field: See how calculated fields can simplify complex expressions.
- Report Header, Footer, Page Header, and Page Footer: Get to know the different sections of a report.
- Reset Page Number on the basis of a Group: Manage page numbering for clearer reporting.
- Create Document Map: Navigate your reports with ease.
- Display first 3 characters of every month: Learn formatting tips for consistent reporting.
- Repeat Column Header on each Page of a Report in SSRS: Ensure critical report information is always visible.
- Freeze the Headers of a Table in the SSRS Report: Keep your data organized even when scrolling through long tables.
- Hide the Advanced Mode: Simplify the report design experience.
- Display Different Currency Symbols in SSRS: Cater to an international audience with currency accuracy.
Parameterized Reports:
- How to Add Parameters in the Report: Learn to make your reports interactive and dynamic.
- DropdownParameters in SSRS Report: Discover how to add dropdown filters to your reports.
- Multi-Select Parameters Option for SSRS Reports: Expand your filtering capabilities to include multiple options.
- Add All option to SSRS dropdown: Include a "Select All" feature in your dropdowns.
- Manually Add the Options in SSRS Dropdown: Customize your dropdown options for precise control.
- Setup Default Value in the Dropdown: Ensure your reports start with meaningful defaults.
- Generate Cascading Parameters in the SSRS Report: Create a linked filtering system for complex data sets.
- Handle Multiple Values in the Cascading Parameters: Master cascading parameters for advanced reporting needs.
- Display No Data Available for Empty Dataset: Learn to handle cases when your report returns no data.
- Use a Column which has Date Datatype as a Parameter: Filter your data based on dates with ease.
Chart Reports:
- Creating Charts: Dive into the world of visual data representation.
- Scale Breaks Option: Learn to emphasize key values in charts.
- Tooltips, Legends, and Other Chart Features: Enhance your charts with user-friendly elements.
- Display Different Currency Symbols in SSRS: Cater to an international audience with currency accuracy.
Advanced SSRS Reporting:
- Using Stored Procedures as Dataset: Leverage your database's stored procedures for efficient data retrieval.
- Subreport in SSRS: Embed one report within another to create dynamic, interconnected reports.
- Calculations with Calculation Items and Parameters: Perform complex calculations directly within your reports.
- Using Variables in Your Reports: Learn how variables can store values throughout the lifetime of a report.
- Tips and Tricks for Optimizing Performance: Ensure your reports run as efficiently as possible, even with large datasets.
Enroll now to transform your data into actionable insights with SSRS! 📊💡 Whether you're a beginner or looking to sharpen your skills, this course is tailored for all levels and will equip you with the knowledge and confidence to create professional and dynamic reports. Let's make data analysis an art form together! 🎨✨
Course Gallery


Loading charts...