Splunk Dashboarding - Unlock the Power

Why take this course?
🌟 Splunk Dashboarding - Unlock the Power 🌟
Unlock the Secrets of Data Visualization with Splunk Dashboards!🚀
Course Headline: Master Splunk Dashboard Creation and Visualization Techniques 🎓✨
Course Description:
Welcome to our Splunk Dashboards and Visualization course on Udemy, where we empower you to become a pro in transforming raw data into compelling visual stories that drive decision-making and strategic planning. This meticulously designed course is tailored to help you grasp the essentials of Splunk's dashboard creation and visualization capabilities.
Key Training Objectives: 🎯
-
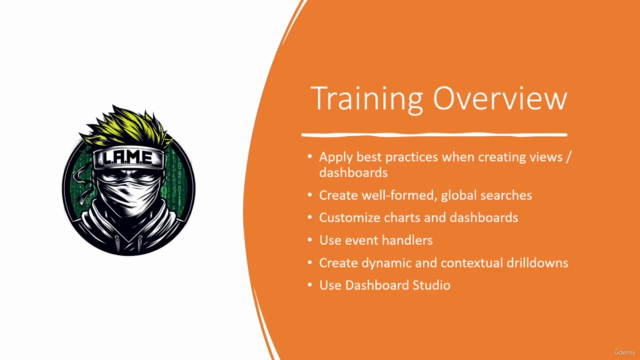
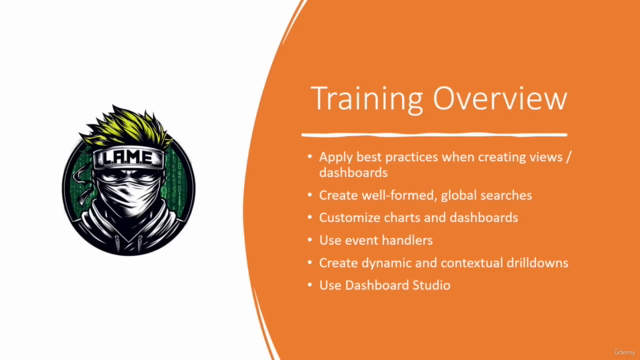
Apply Best Practices When Creating Views/Dashboards:
- Learn the principles of designing intuitive and efficient dashboards.
- Understand how to structure your views effectively for maximum user value.
-
Create Well-Formed, Global Searches:
- Master the art of writing searches that are efficient and reusable across various dashboards.
- Ensure consistency in data outputs by employing global searches.
-
Customize Charts and Dashboards:
- Enhance your skills to tailor charts and dashboards for specific business scenarios.
- Utilize Splunk's wide range of visualization tools to represent data compellingly.
-
Use Event Handlers:
- Implement interactive components in your dashboards using event handlers.
- Trigger actions based on user inputs or specific events for a more dynamic user experience.
-
Create Dynamic and Contextual Drilldowns:
- Master the technique of creating drilldowns for deeper data insights.
- Set up drilldowns that dynamically adjust to the user's exploration path.
-
Use Dashboard Studio:
- Explore advanced features in Splunk's Dashboard Studio.
- Design custom layouts and integrate diverse data sources for sophisticated dashboards.
Why Take This Course? 💡
By the end of this comprehensive course, you will not only be well-versed in creating Splunk dashboards, but you'll also know how to:
- Design dashboards that are both powerful and user-friendly.
- Apply best practices for dashboard creation and data visualization.
- Implement interactive and responsive dashboards using event handlers.
- Create drilldowns that provide a deeper understanding of your data.
- Leverage Dashboard Studio to produce visually stunning dashboards.
Whether you are new to Splunk or looking to enhance your existing skills, this course is the perfect stepping stone to becoming an expert in Splunk dashboarding and visualization. Equip yourself with the knowledge and hands-on experience needed to turn your data into a source of actionable intelligence. 📊🚀
Join us now and embark on a journey to unlock the full potential of Splunk Dashboards! Enroll today and transform how you interact with data! 🕰️✨
Course Gallery


Loading charts...