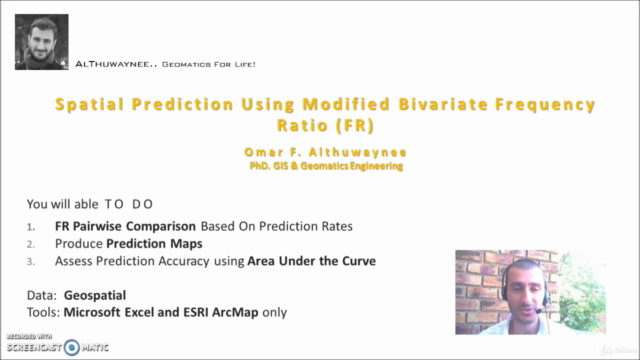
How to Produce Prediction Map in GIS With ArcGIS and Excel?

Why take this course?
🎉 How to Produce Prediction Map in GIS With ArcGIS and Excel 🌏🔍
Unlock the Power of Predictive Geospatial Analysis with Dr. Omar AlThuwaynee's Step By Step Guide!
Are you ready to venture into the fascinating world of geospatial prediction mapping? With ArcGIS and Excel, you can transform raw data into actionable insights on hazards prediction. This comprehensive course is meticulously designed for enthusiasts and professionals alike, who aim to harness the capabilities of GIS and statistical analysis to create precise and reliable prediction maps.
Why Choose This Course?
- Historical Context: Dive into the evolution of geographic information systems since the late 1980s and understand the significance of data-driven methods in spatial analysis.
- Expert Guidance: Learn from Dr. Omar AlThuwaynee, an expert who has a strong background in GIS applications, especially in environmental risk assessments.
- Mastering Frequency Ratio Technique: Grasp the nuances of a robust bivariate technique that is widely used for producing prediction maps with ArcMap and Excel.
- Hands-On Learning: Engage in practical exercises that will equip you with the skills to conduct spatial correlation analysis, autocorrelation assessment, and produce susceptibility maps using real-world scenarios.
- Statistical Validation: Learn how to validate your model predictions effectively using the Area Under the Curve (AUC) method, ensuring your maps are both accurate and reliable.
-
Introduction to GIS in Predictive Analysis
- The role of GIS in modern data analysis.
- Overview of prediction mapping and its applications.
-
Understanding the Frequency Ratio Model
- The mechanics behind the frequency ratio technique.
- How to apply this method to your data for effective predictions.
-
Data Preparation in Excel
- Data formatting and cleaning essentials.
- Setting up your dataset for GIS analysis.
-
Spatial Correlation Analysis
- Identifying the relationship between prediction factors and dependent variables.
- Techniques to measure this relationship accurately.
-
Autocorrelation and Prediction Factor Importance
- Understanding autocorrelation and its importance in predictive modeling.
- How to assess the contribution of each prediction factor.
-
Producing Susceptibility Maps with ArcGIS & Excel
- Step-by-step instructions on creating a susceptibility map.
- Integrating your Excel data into ArcGIS for visualization and analysis.
-
Model Validation and Evaluation
- Learning the AUC method to validate your model's predictions.
- Ensuring your prediction maps are statistically sound.
Upon completion of this course, you will be equipped with the knowledge and skills to:
- Confidently produce prediction maps using ArcGIS and Excel.
- Understand the spatial relationships in data that influence predictive outcomes.
- Evaluate the importance of each variable in your predictions.
- Validate your models effectively for practical applications in hazards prediction.
- Exclusive access to full course materials and datasets.
- Interactive exercises and real-world case studies.
- Ongoing support from the instructor and fellow learners.
- Downloadable resources and reference materials for future use.
Join us now and embark on a journey to master geospatial prediction mapping with ArcGIS and Excel. Whether you're a GIS analyst, environmental scientist, urban planner, or simply a curious mind, this course is your gateway to unlocking the full potential of predictive spatial analysis.
Sign up today and transform your data into actionable intelligence! 🚀📊
Course Gallery


Loading charts...