Spatial Data Visualization and Machine Learning in Python

Why take this course?
🚀 Course Title: Spatial Data Visualization and Machine Learning in Python
🎓 Course Headline: Building an Analytics Dashboard to Analyze and Predict Quakes using Bokeh and Python
Welcome to the 'Spatial Data Visualization and Machine Learning in Python' Course! 🌟
Dive into the world of spatial data analytics with our comprehensive course designed to empower you with the skills to visualize, analyze, and predict geospatial data using the Python programming language and the Bokeh library.
Why Choose This Course?
- Interactive Learning: Engage with real-world datasets and build a fully functional analytics dashboard that not only displays data but also makes predictions.
- Powerful Visualization: Learn to harness the capabilities of Bokeh to create dynamic, interactive plots that can be shared on the web.
- Data Analysis Mastery: Gain hands-on experience with Jupyter Notebooks for data manipulation and cleaning to prepare your datasets for analysis and prediction.
Course Overview:
📊 Introduction to Bokeh: We'll kick off the course by introducing you to Bokeh, a robust library for creating interactive plots and dashboards in Python. You'll learn how Bokeh can take your data visualization to the next level, providing insights that static charts just can't deliver.
Key Learning Objectives:
- Spatial Data Visualization: Learn how to effectively represent geospatial data using a variety of Bokeh charts and maps.
- Data Preparation: Get hands-on practice in manipulating, cleaning, and transforming datasets into a format suitable for analysis.
- Machine Learning with GeoSpatial Data: Explore the intersection of machine learning and geospatial data to create predictive models that can forecast events like earthquakes.
- Building Dashboards: Create interactive dashboards that visualize your data, providing insights at a glance.
- Geo Mapping Basics: Understand the fundamentals of mapping geographic information.
- Server Setup: Learn how to set up a lightweight server to serve your dashboard, making it accessible via a URL.
What You Will Do:
- Visualize spatial data and analyze results in various Bokeh charts.
- Use Jupyter Notebooks for end-to-end data analysis workflows.
- Clean, manipulate, and transform messy real-world data into a structured format.
- Apply machine learning techniques to geospatial datasets for predictive modeling.
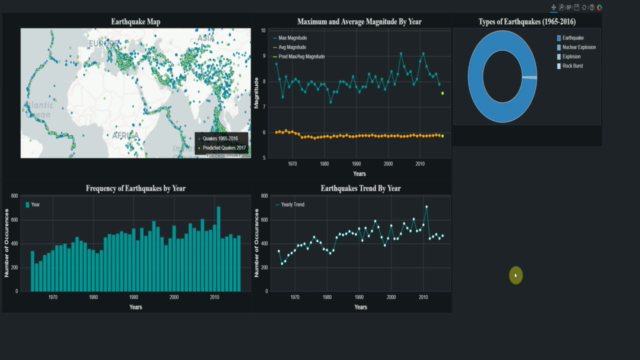
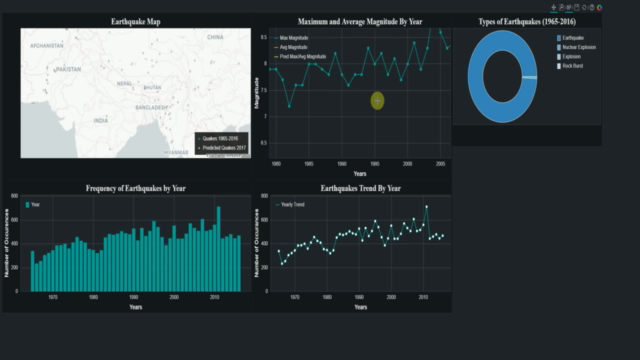
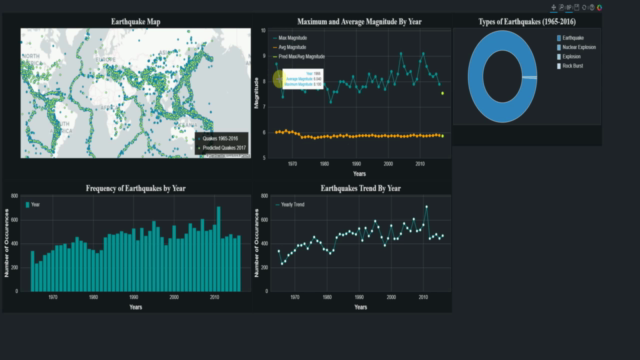
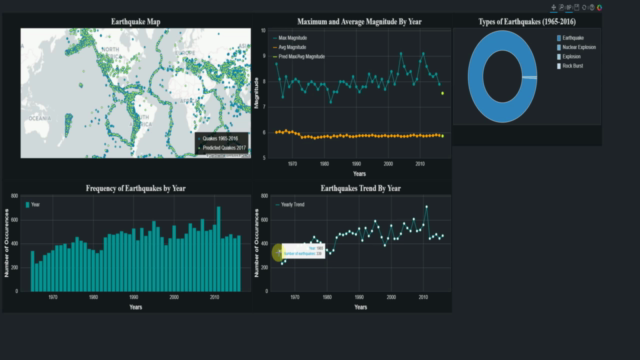
- Build an interactive dashboard that combines all the above elements to provide a powerful tool for earthquake prediction analysis.
Course Breakdown:
- Understanding Bokeh: Get to grips with Bokeh's architecture and how it converts Python code into interactive web visualizations.
- Data Preparation Techniques: Learn best practices for prepping your data, including cleaning, transforming, and structuring your datasets.
- Machine Learning with Spatial Data: Discover how to integrate machine learning algorithms into your spatial data workflows.
- Building Interactive Dashboards: Create dashboards that visualize your data, allowing for dynamic interaction and analysis.
- Deploying Your Dashboard: Set up a server to share your dashboard with the world, enabling others to access it through a web browser.
By the end of this course, you will have built a powerful analytics dashboard to analyze spatial data and predict earthquakes, equipping you with invaluable skills for a wide range of data-driven applications.
🛠️ Tools & Technologies: Python, Bokeh, Jupyter Notebooks, Geospatial Datasets, Machine Learning Algorithms.
🎓 Who is this course for?
- Data Analysts looking to expand their skills into geospatial analysis and visualization.
- Data Scientists aiming to incorporate machine learning with spatial data.
- Software Developers interested in building interactive data applications.
- Anyone curious about the intersection of data science, geospatial analysis, and web development.
Join us on this journey to transform raw data into actionable insights and predictions using the power of Python, Bokeh, and your newfound expertise in Spatial Data Visualization and Machine Learning! 📊✨
Course Gallery


Loading charts...