Box Plot Analysis in Minitab – Tabtrainer® for Quality Teams
Why take this course?
🚨 Course Alert: Tabtrainer Minitab - Mastering Box Plot Analysis 🚨
🚀 Course Title: Tabtrainer Minitab: Box Plot Analysis with Prof. Dr. Murat Mola, Germany's Professor of the Year 2023! 🚀
🎓 Headline: Elevate Your Data Game - Discover the Secrets of Box Plots with an Award-Winning Expert!
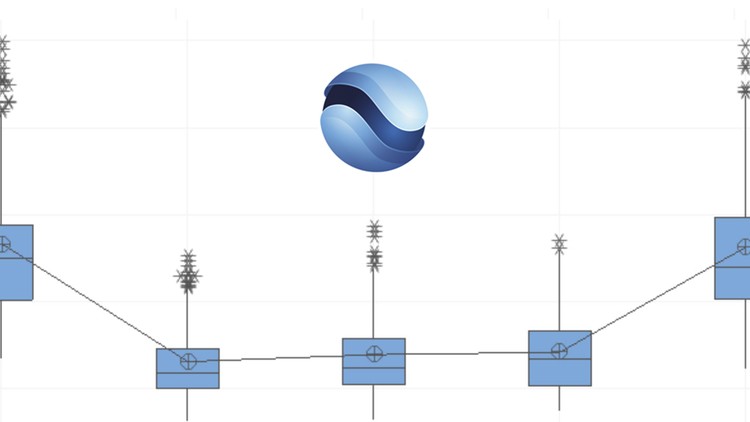
Dive into the world of data visualization and statistics with our expert-led course on Box Plot Analysis using Minitab. Taught by the esteemed Prof. Dr. Murat Mola, this training is designed to transform your approach to analyzing categorical data groups and identifying trends within them.
🔍 What You'll Learn:
-
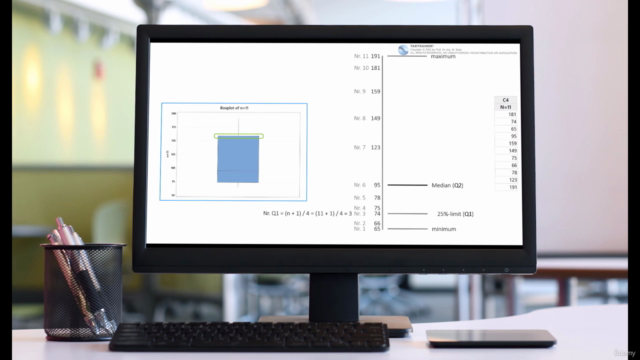
Fundamentals of Box Plot Analysis: Get acquainted with the core concepts of box plots, including the calculation of quartiles, median, and interquartile range (IQR), which are essential for interpreting data distributions.
-
Application Across Varieties:
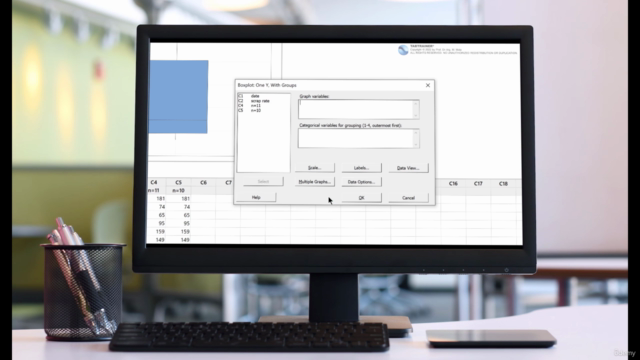
- Learn about the four types of box plots and how they differ in categorical vs. response variables.
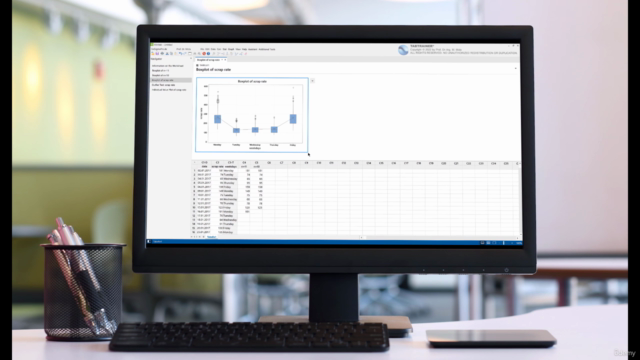
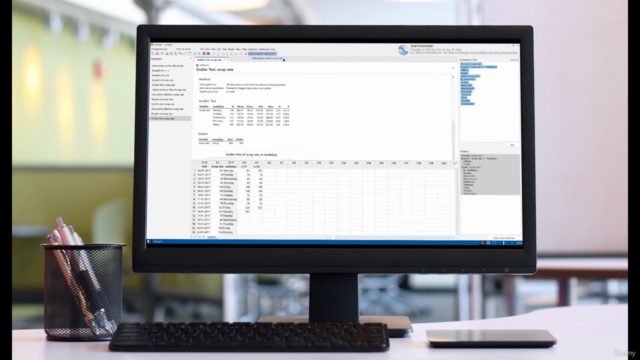
- Use real-world scenarios from the Smartboard Company to analyze scrap rates across weekdays, uncovering insights that can improve process outcomes.
-
Advanced Skills Development:
- Automate data analysis tasks with Minitab's Command Line History and create macros in Exec format for repetitive analyses like box plots and outlier tests.
- Develop a custom Daily Quality Analysis menu for streamlined, one-click execution of your most frequent tasks.
- Enhance visualizations by incorporating additional elements, such as arithmetic mean and trend lines into your data representations.
🛠️ Practical Application:
- Learn to analyze weekday-specific box plots to identify inconsistencies in production processes.
- Find out how to maintain stable production processes throughout the week, which is critical for maintaining high product quality.
- Streamline your workflow with automated Minitab macros that save time and improve efficiency.
- Export and report your project results, ensuring consistency and clarity in your data analysis documentation.
🎉 **Key Features of the Course:**🎓
- Hands-On Learning: Engage with real-world datasets and interactive exercises to apply what you learn.
- Expert Insights: Leverage Prof. Dr. Murat Mola's expertise, recognized as Germany's Professor of the Year 2023.
- Realistic Scenarios: Analyze actual data from industry leaders like the Smartboard Company to understand the practical implications of your analysis.
- Customization Skills: Develop your ability to customize Minitab procedures and create macros for complex analyses.
- Efficiency Mastery: Streamline repetitive tasks with automation and build a Daily Quality Analysis menu for consistent use.
By the end of this course, you'll not only have a deep understanding of Box Plot Analysis but also be equipped with the skills to optimize your quality processes using Minitab. Join us to become a top-level expert in statistical data analysis and make an impact in your field! 📈💖
Enroll now and take the first step towards becoming a master of data visualization and analysis with Minitab! 🌟🚀
Course Gallery
Loading charts...