SAS for Data Analysis and Visualization

Why take this course?
🎓 Course Title: SAS for Data Analysis and Visualization
🚀 Course Headline: Master Data Visualization, Data Manipulation, and Data Handling with SAS and SAS SQL - Transform Your Career in Data Science! 💻
Unlock the Power of Data with SAS!
Whether you're just starting out or a seasoned professional, this comprehensive online course is your gateway to mastering SAS for data analysis and visualization. Dive into the world of SAS PROC procedures and SAS SQL, and learn how to handle complex datasets with ease.
Why Choose This Course?
- Tailored for Beginners/Professionals: No prior experience with SAS required! Start from scratch or elevate your existing skills.
- Industry-Relevant Skills: Gain valuable expertise in data visualization and manipulation, essential for roles in Data Science, Data Analysis, Data Management, and Data Mining.
- Hands-On Learning: Engage with real-world scenarios and practical examples to apply what you learn directly to your work.
- Versatile Tool: Discover how SAS can handle various data types and complex analysis tasks that other tools cannot.
Course Highlights:
- Fundamentals of SAS: Get to grips with the basics and understand the environment and architecture of SAS.
- Data Manipulation Techniques: Learn how to clean, process, and prepare data for analysis using SAS programming.
- Advanced Data Handling: Explore advanced features of SAS, including complex data types and large datasets.
- SAS SQL Mastery: Command the power of SQL within SAS to perform queries and generate meaningful insights from your data.
- PROC Procedures: Understand the different PROC procedures available in SAS, such as PROC MEANS, PROC FASTCLUS, and more.
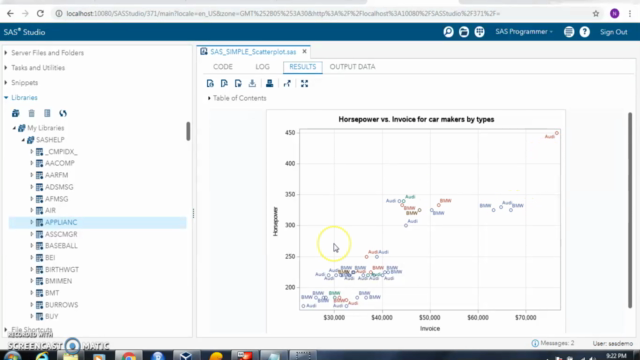
- Data Visualization Techniques: Learn to create compelling visualizations using SAS/Graph software, including charts, graphs, and interactive dashboards.
- Real-World Application: Apply your new skills to real-world datasets and projects, showcasing your ability to analyze and visualize data effectively.
What You Will Learn:
- Data Importing: Efficiently bring in data from various sources like spreadsheets, databases, and the web.
- Data Transformation: Master techniques for transforming and manipulating datasets to suit your analysis needs.
- Advanced Analytics: Perform complex analyses with SAS/STAT software, including regression, ANOVA, and multivariate analyses.
- Reporting and Dashboards: Generate dynamic reports and dashboards that provide clear visual insights into the data.
- Best Practices: Learn the best practices for data analysis and visualization with SAS to ensure your results are accurate and reliable.
Your Instructor:
Nishant Pandey, an experienced SAS professional and data scientist, will guide you through this journey. His expertise and engaging teaching style make complex concepts understandable and easy to apply.
Enroll in this course today and take the first step towards becoming a proficient SAS user, adept at analyzing and visualizing data to drive informed decision-making. 🌟
Don't miss out on this opportunity to upskill and future-proof your career with SAS for Data Analysis and Visualization!
Course Gallery


Loading charts...