SAP Crystal Reports:Master-Detail,Cross-Tab,Sub-Reports

Why take this course?
🚀 Design Business Intelligence Reports and Drill Down Data with SAP Crystal Reports!
🎓 Course Overview: Are you ready to unlock the full potential of SAP Crystal Reports to create compelling business intelligence (BI) reports? Whether you're a developer, programmer, or system analyst, this course is your gateway to mastering the art of data visualization and analysis. Dive deep into the world of Master Detail reports, Cross Tabulations, and Sub-Reports to transform raw data into actionable insights.
📊 What You'll Learn:
-
Lesson One: Linking the Data Puzzle
- a) Link Tables of Database: Understand how to connect various database tables to ensure accurate and comprehensive data sets.
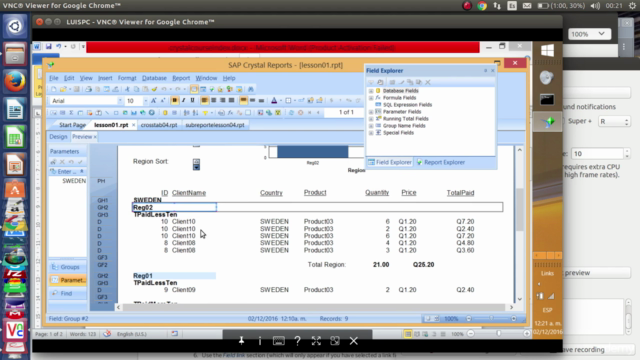
- b) Master Detail Report: Learn to represent complex business transactions, such as client sales, with detailed precision.
- c) Calculations Formula for Master Detail Report: Discover the power of formulas that provide critical insights into your data.
- d) Group Fields: Organize and summarize data for easier comprehension using group fields.
- e) Charts of Group Fields: Visualize your data with dynamic, informative charts that can tell a story all on their own.
-
Lesson Two: Total Recovery
- a) Total in Fields: Learn to include totals and subtotals in fields to highlight key financial or numerical metrics.
- b) Group by Criteria: Group your data intelligently based on custom criteria for more focused analysis.
- c) Sort Control for User: Empower users with the ability to sort report data according to their preferences.
-
Lesson Three: Select Expert & Advanced Charts
- a) Select Expert: Utilize this powerful feature to filter data based on specific criteria, ensuring the most relevant information is displayed.
- b) Advanced Charting: Create sophisticated charts that allow users to drill down into the details behind the numbers.
- c) Pass User Parameters to Select Expert: Incorporate user inputs dynamically within your reports for a personalized experience.
-
Lesson Four: Cross Tab Revolution
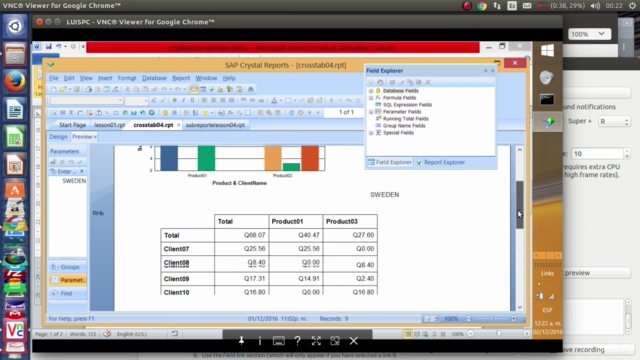
- a) Cross Tab Reports: Present complex data in an easy-to-understand tabular format with cross tabs.
- b) Cross Tab Charts: Transform your cross tab reports into engaging and interactive charts for enhanced visual appeal.
- c) Include Formula Field in Cross Tab Report: Add custom calculations within cross tabs to provide deeper insights.
- d) User Defined Parameter for Drill Down Details: Enable users to explore the data at a more granular level by applying their own filters and parameters.
-
Lesson Five: The Power of Sub Reports
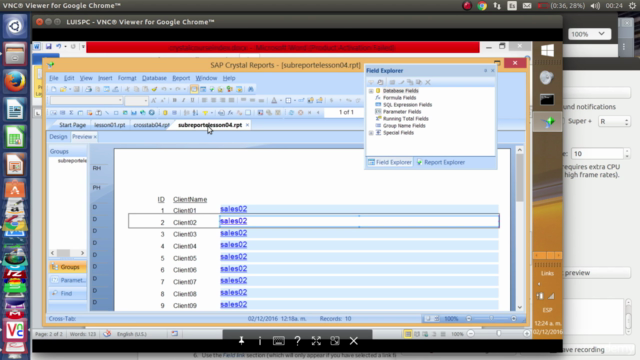
- a) Sub Reports: Create linked sub reports that provide additional context and details within a master report.
- b) Linked Sub Reports for Master Detail Relationship: Learn how to effectively link sub reports to master reports, ensuring a seamless flow of information.
💡 Why Take This Course? By the end of this course, you'll have a solid understanding of SAP Crystal Reports and how to leverage its capabilities for real-world business intelligence applications. You'll be equipped to design reports that not only present data clearly but also allow for deep analysis and decision-making. Whether you're analyzing sales data or tracking customer behavior, this course will empower you with the skills needed to make informed strategic decisions.
🎓 Who Is This Course For? This course is ideal for:
- Developers looking to enhance their reporting capabilities.
- Programmers aiming to master data visualization tools.
- System analysts in need of powerful report generation techniques.
🔥 Join us and transform your approach to data analysis with SAP Crystal Reports! 🌟
Course Gallery


Loading charts...