Data Analytics with Excel: For SaaS & Software Companies

Why take this course?
🌟 Welcome to "Data Analytics with Excel for SaaS & Software Companies"! 🌟
Course Description:
Are you a data analyst at a technology, software, or SaaS company looking to sharpen your skills with Excel? Or perhaps you're aiming to transition into a role that involves heavy data analysis? Look no further! 📊✨
"Data Analytics with Excel for SaaS & Software Companies" is meticulously designed to equip you with the practical skills to analyze, interpret, and communicate complex datasets effectively. This course goes beyond theory and dives deep into real-world scenarios that software companies face every day. From analyzing bookings and Annual Recurring Revenue (ARR) to understanding customer trends and forecasting, this course covers it all. 🚀
Course Objective:
By the end of this course, you will be proficient in:
- Manipulating raw data to suit your analysis needs.
- Analyzing financial and operational metrics crucial for SaaS businesses.
- Creating pivot tables, building summary tables, and adding metrics to track and analyze trends.
- Designing effective graphs and formatting charts tailored for presentations.
- Constructing slides with compelling insights, ready for executive meetings or client pitches.
- Performing simple forecasting using Excel tools to predict future trends within your SaaS company. 📈
What You'll Get:
This course is packed with resources to ensure a comprehensive learning experience:
- High-Quality Videos: Learn visually through step-by-step instructions.
- Tutorials/Demos: Watch real-life examples of Excel analytics in action.
- Data Files: Work with actual datasets, including templates and solutions for practice.
- Exercises: Test your skills with hands-on exercises after each section.
- Excel Keyboard Shortcuts and Tips: Master Excel more efficiently with insider tips and tricks. 🖥️🔧
Course Content Breakdown:
Overview:
- Course Welcome
- Workbook and Supporting Files
- Excel Setup & Tips
Bookings Analysis:
- Bookings - Section Intro
- Bookings - Examine Raw Data
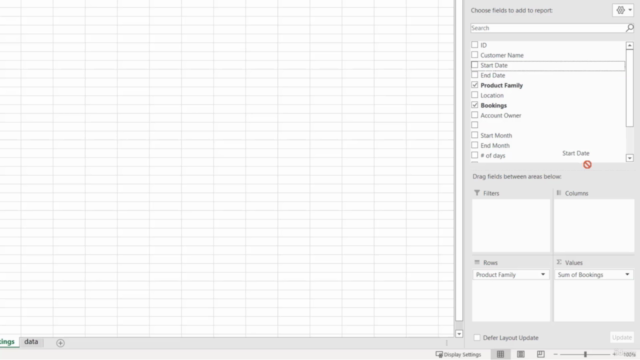
- Bookings - Create Pivot Tables
- Bookings - Build Summary Tables
- Bookings - Calculate New/Expand/Downsell/Churn
- Bookings - Build Bookings Summary Table
- Bookings - Add Trended Metrics
- Bookings - Build Bookings Charts
- Bookings - Build Presentation Slides
ARR Analysis:
- ARR - Understanding Net Retention Rate
- ARR - Analysis
- ARR - Term Length Analysis
- And more...
Customer Analysis:
- Customer Analysis Overview
- Customer Trend Metrics
- Customer Trends - Charts
- Average Selling Price (ASP) - Introduction and Calculation
- Average Selling Price (ASP) - Charts
Sales Productivity Analysis:
- Sales Productivity - Analysis
- Sales Productivity - Charts
Forecasting Overview:
- Forecasting Methodology Overview
- Forecasting Demo
- Exercise: Forecast
🎓 Embark on Your Data Analytics Journey with Excel today! 🎓
Dive into the world of data analysis and visualization, tailored specifically for the SaaS and software industry. Elevate your skillset and become a key player in interpreting and presenting data that drives business decisions. Let's get started! 🚀🎉
Course Gallery


Loading charts...