React Data Visualization - Build a Cryptocurrency Dashboard

Why take this course?
🚀 React Data Visualization - Build a Cryptocurrency Dashboard 📊💡
Course Headline: Learn industry secrets of building beautifully fast dashboards with React, Context API, styled-components & CSS Grid!
Warning: This is an advanced course for web developers already familiar with the basics of React and JavaScript! If you're ready to level up your skills, let's dive into the world of data visualization with React.
Course Overview:
In this comprehensive course, you'll build a complete Cryptocurrency Dashboard that showcases your expertise in React and your ability to handle complex data visualization tasks. You'll learn how to create a responsive and interactive dashboard that will impress both users and employers alike. 🌟
Key Features of the Course:
-
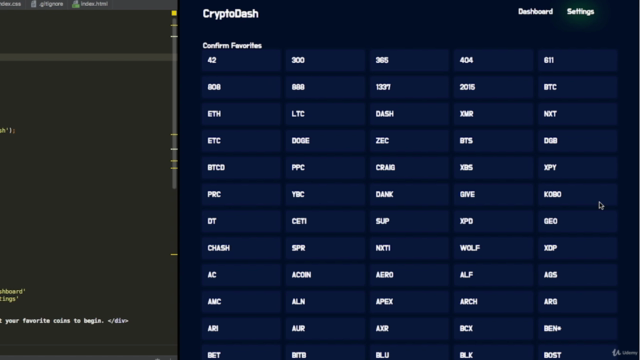
Settings Page with Intro Greeting:
- Customize user greetings on first visit.
- Allow users to select their favorite cryptocurrencies.
- Offer a complete list of all coins with fuzzy search capabilities.
- Enable hover and selection interactions for coins.
- Provide functionality to add/remove coins from the favorites list.
- Disable chosen coins and confirm favorites, saving these values for the user.
-
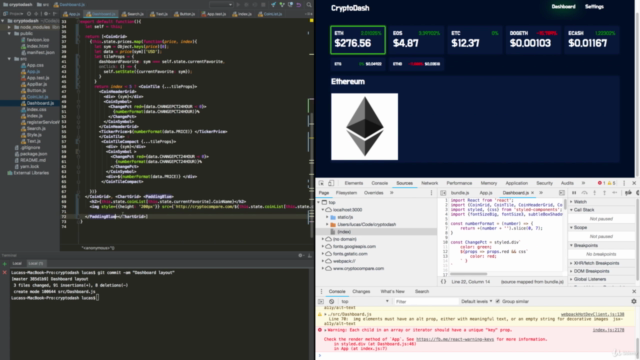
Dashboard:
- Initializes data from remembered favorites or redirects to the Settings page.
- Display 5 major cards for the first 5 favorites and compact cards for the next 5.
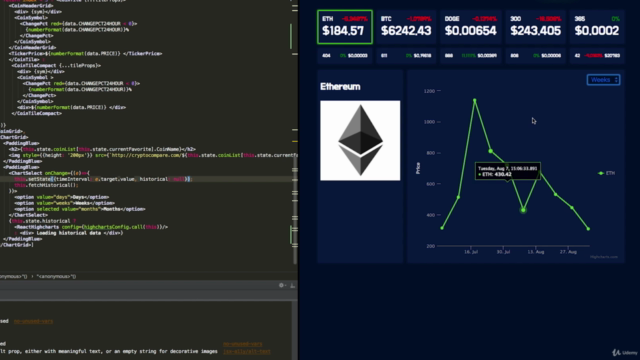
- Render a line chart with historical price data for the current favorite symbol.
- Allow users to select different coins, which will fetch new data and remember the user's favorite.
- Users can view historical price points over various time periods (Days, Weeks, Months).
- Display the name and image of each coin next to its chart.
-
BONUS: Themes:
- Configure the app's theme to be dark or light with ease.
React isn't just for experts; it's a perfect starting point for beginners. Its declarative nature and component-based architecture make building apps a breeze. With create-react-app, you get an all-in-one starter kit that simplifies your development process by handling the configuration of Webpack, Babel, and other build tools for you.
What You'll Learn:
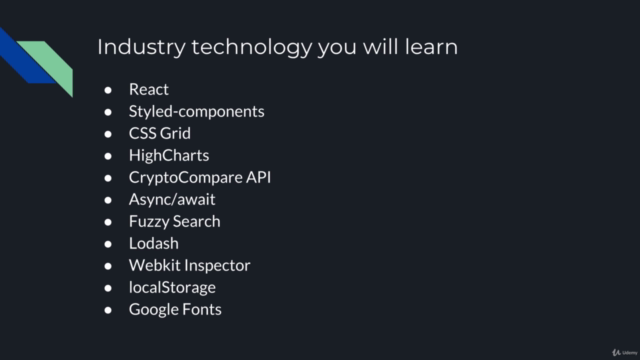
- Every step of building the project from scratch, with no steps skipped.
- How to use React Context to manage state efficiently.
- The power of styled-components v4 in the CSS-in-JS paradigm.
- Integrating HighCharts with React to create dynamic data visualizations.
- Advanced state management for handling complex data modifications, focusing on maintaining a clean and efficient React state.
Why This Course?
- Interactive Learning: You'll build a real-world application that you can use in your portfolio or even deploy.
- Expert Guidance: The course is designed by industry experts who understand the nuances of data visualization with React.
- Community Support: If you have any questions, our supportive community and instructors are here to help you every step of the way.
What You'll Need:
- Basic knowledge of React and JavaScript.
- A text editor or IDE of your choice (like Visual Studio Code).
- A code versioning tool like Git.
- The desire to push your web development skills to the next level!
Best of luck with CryptoDash! With the knowledge you'll gain from this course, you'll be well on your way to becoming a React data visualization pro. 🎯🚀
Remember, we're here to support you throughout this learning journey. If you have any questions or need assistance, don't hesitate to reach out. Let's build something amazing together!
Course Gallery


Loading charts...