Rainfall Indices for MCDM models in ArcGIS: how and Why?

Why take this course?
🌧 Rainfall Indices for MCDM Models in ArcGIS: Master the Skills!
Course Overview:
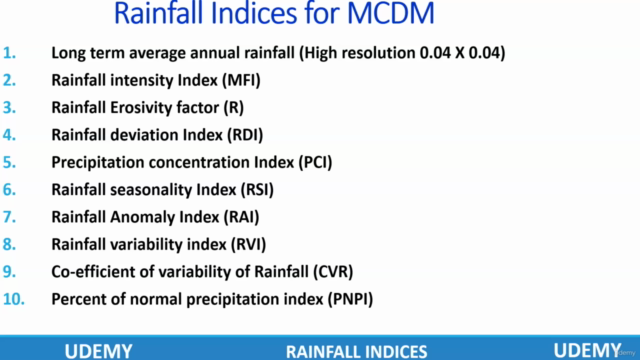
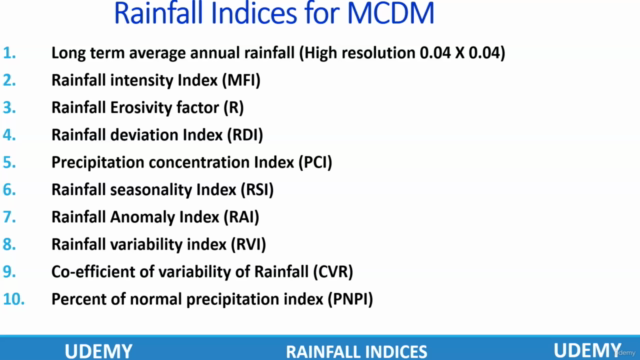
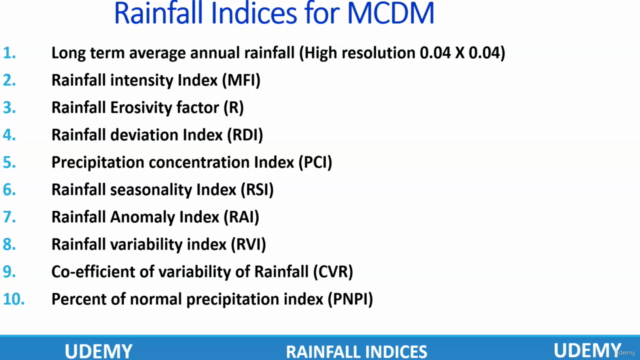
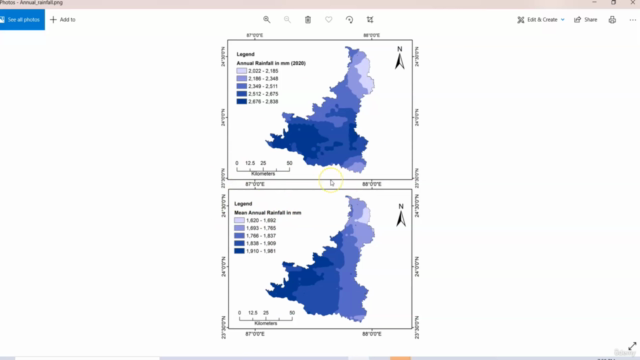
Dive into the world of hydrological analysis with our comprehensive course, where we explore the intricacies of rainfall data through the lens of Multicriteria Decision Making (MCDM) models. Learn to prepare 10 critical rainfall indices and 14 detailed maps, including the Long Term Average Annual Rainfall (High resolution 0.04 X 0.04), using a blend of Excel, ArcGIS, and QGIS. This course is designed to equip you with the knowledge and tools necessary to understand why these indices are vital for effective MCDM models and time series analysis.
Course Content Breakdown:
1. Data Preparation:
- Download Rainfall Data: Get started by sourcing reliable rainfall data for your analysis.
- Process Data: Learn the essential steps to process this data accurately.
- Convert Data: Transform daily rainfall data into meaningful monthly figures.
2. Rainfall Indices Explained:
-
Long Term Average Annual Rainfall (High Resolution): Understand the significance of this index for long-term planning and prediction.
-
Rainfall Intensity Index (by MFI): Discover how to calculate this index, which plays a crucial role in assessing flood potential and land degradation risks.
-
Rainfall Erosivity Factor (R): Master the methodology of Wischmeier and Smith (1978) with Arnoldus' modifications to compute this key erosivity factor.
-
Precipitation Concentration Index (PCI): Learn from Oliver (1980) how to quantify periodic rainfall variations and concentration, essential for land management and soil conservation strategies.
-
Rainfall Seasonality Index (RSI): Explore the work of Walsh and Lawler (1981) on assessing seasonal contrasts in rainfall amounts.
-
Rainfall Anomaly Index (RAI): Gain insights into depicting dryness and wetness patterns with van Rooy's (1965) index.
-
Rainfall Variability Index (RVI): Understand the variability of rainfall within a region and how it affects agricultural planning and water resource management.
-
Coefficient of Variation (CV): Learn to apply this statistical measure to assess the dispersion of your data points over the mean, crucial for risk assessment and reliability analysis.
-
Percent of Normal Precipitation Index (PNPI): Simplify the measurement of deviation from a long-term average precipitation value at a location.
3. MCDM Models Integration:
- Using Excel: Streamline your calculations and analysis with spreadsheet wizardry.
- Using ArcMap: Visualize your data and indices with interactive maps, enhancing your decision-making capabilities.
Why Master These Indices?
Rainfall intensity, for instance, is a fundamental component in understanding the impact of storms on flood magnitude, flash floods, desertification, bank erosion, gully erosion, land degradation, sediment flux, and soil erosion. It's not just about the amount of rainfall; it's about how that rainfall occurs over time.
The Rainfall Erosivity Factor (R) is a testament to this, as it combines volume, intensity, and duration of storms into one comprehensive measure. This index is invaluable for predicting soil erosion and sediment yields in watersheds.
The Precipitation Concentration Index (PCI) complements the R factor by quantifying the periodic variation of rainfall, focusing on the concentration aspect and its implications for land management and conservation.
The Rainfall Seasonality Index (RSI) and Rainfall Anomaly Index (RAI) provide insights into seasonal trends and anomalies, respectively, aiding in the prediction of droughts or surpluses and enabling better planning and resource allocation.
By mastering these indices and learning how to integrate them into MCDM models using ArcGIS, you'll be well-equipped to tackle real-world hydrological challenges with confidence. After completing this course, you will have a robust set of analytical tools at your disposal, enabling you to make informed decisions for environmental management and sustainable development planning.
Enroll now to transform your data into actionable insights with Rainfall Indices for MCDM Models in ArcGIS! 🌧️📊✨
Course Gallery


Loading charts...