R Shiny Flex Dashboard Interactive Data Visualization

Why take this course?
🌟 [The Fastest & Easiest Way to Build R Shiny Dashboard Applications] 🌟
Course Headline:
Transform Your Data Analysis Skills with R Shiny Flex Dashboard
Course Description:
Are you ready to revolutionize the way you handle data visualization and analysis? 🚀
Do you want to cut down the time it takes to learn how to build interactive applications using Shiny in R? Are you fed up with the tedious process of piecing together outdated information scattered across the internet? Jonathan Ng, your expert course instructor, is here to guide you through the most efficient and up-to-date methods for creating R Shiny Dashboard applications.
Why This Course? 🎓
- Outdated Information Problem Solved: Discover how 99% of available R information is outdated and how you can leapfrog this by using the latest libraries and techniques.
- Modern R Skills: Learn to use the best new libraries that leverage the intelligence of some of the world's smartest minds in data analysis.
- Less Code, More Impact: Write simpler and more concise code to create stunning applications with less effort and time.
- Cutting-Edge Learning: Master the most efficient methods for app development with R Shiny that outshine traditional methods and platforms like Python.
- Versatile Publishing: Easily publish your content across multiple formats including web pages, books, slide decks, and interactive dashboards.
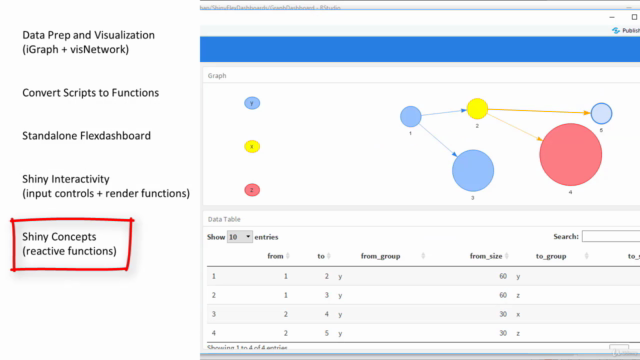
- Graph Network Analysis: Explore the revolutionary potential of graph network analysis in your data workflow and learn how to implement it effectively in your dashboard.
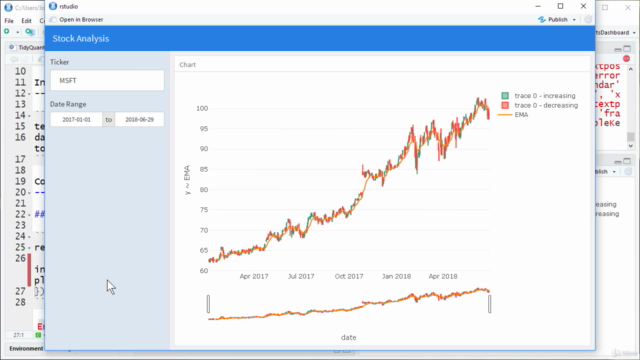
- Stock Market & Timeseries Analysis: Utilize the latest libraries for stock and timeseries data to analyze entire portfolios and employ advanced machine learning techniques.
What You'll Learn:
- Simplified Code Writing: Master the art of writing simpler code for R Shiny applications, cutting down on the typical time needed to learn app development by half.
- Dynamic Function Creation: Write your own functions in R and make them incredibly dynamic with concepts like tidy evaluation.
- Flexible Dashboards: Make your dashboards more flexible and versatile, allowing for a range of different publishing formats.
- Graph Visualizations: Implement graph visualizations within your dashboard to enhance data storytelling and analysis.
- Stock & Timeseries Data Analysis: Learn how to analyze stock markets and timeseries data with the latest tools and libraries, embedding these capabilities into your applications.
Your Instructor:
Jonathan Ng has a passion for making data analysis accessible and exciting. With his expertise in R Shiny and Flex Dashboard, he will guide you through each step of building interactive applications with ease. Jonathan's approach is designed to help you apply these skills to your work immediately, ensuring a hands-on learning experience that will set you apart from the competition.
Don't Miss Out! 🎢
Join Jonathan Ng in this comprehensive course and unlock the potential of R Shiny Dashboards. Whether you're a data analyst, researcher, financial expert, or simply a data enthusiast, this course will provide you with the skills to turn your data into dynamic, interactive visualizations that captivate and inform.
Enroll now and start building your future in data analysis today! 🎉
Course Gallery


Loading charts...