Graphics in R: Data Visualization and Data Analysis with R

Why take this course?
📘 Course Title: Graphics in R: Data Visualization and Data Analysis with R
Course Headline:
🎓 Advance Your Data Visualization Skills Using R Packages. Master ggplot2, lattice, interactive plots with ggvis package!
Course Description:
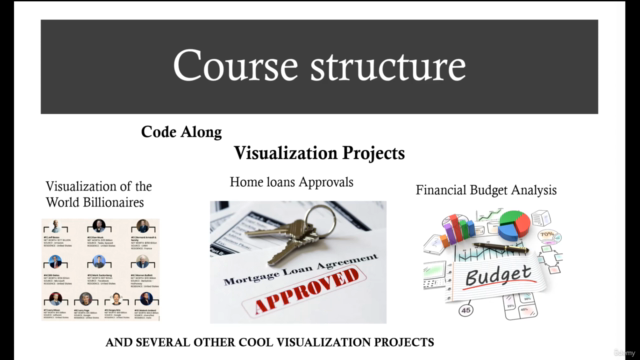
Learn data visualizations by working on projects that utilize real-world datasets from professional industries such as finance, marketing, and sales.
This course is designed to help you master data visualization techniques using R packages like ggplot2, the lattice package, and the ggvis package from shiny for interactive graphics. By leveraging these tools, you'll be able to create compelling visualizations that can interpret and present complex data with ease.
Why Learn Data Visualization with R?
Data Visualization is a powerful tool that helps people understand and interact with data. It makes complex information more accessible, allowing everyone—regardless of their expertise level—to grasp trends, outliers, and useful insights hidden within the data. In an age where Big Data and Artificial Intelligence (AI) are prevalent, visualization is crucial for making sense of the vast amounts of data generated every day.
R, with its powerful libraries, allows us to create visually appealing graphics with just a few lines of code. It's user-friendly, especially when it comes to data visualization, customizable graphics, and data analysis. With R, you can easily modify aspects like axes, fonts, legends, annotations, and labels.
Course Outline:
- R for Beginners: Get comfortable with vectors, matrices, arrays, data frames, and lists.
- Factors in R: Learn to create factors and understand factor levels.
- Regular Expressions in R: Master the
grepandgsubfunctions for text manipulation. - Reshape Package for Data Analysis: Use
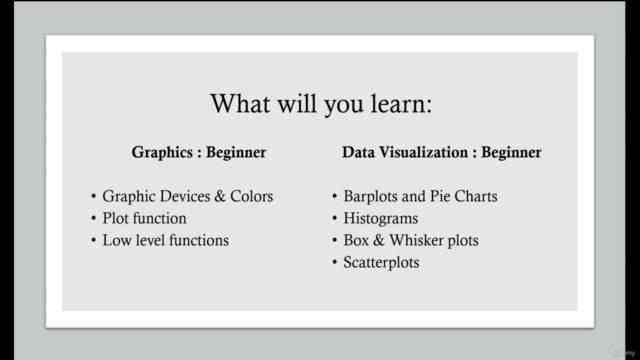
meltandcastfunctions to manipulate data structures. - Intermediate Data Visualization & Graphics in R: Dive deeper into ggplot2 with
qplot()andggplot()functions. - Data Visualization with Lattice Package: Explore high-level lattice functions and panel customization.
- Control and Enhance Your Plots: Learn to manage scales, guides, and themes for a polished look.
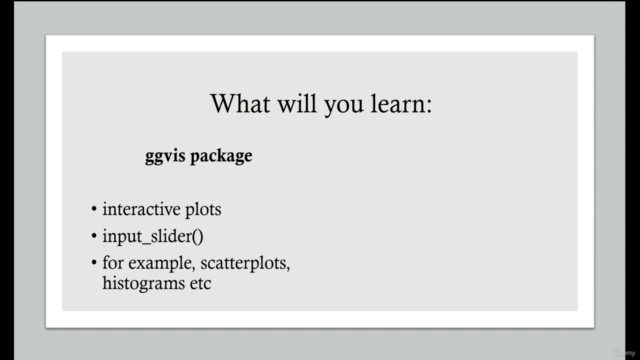
- Interactive Data Visualization with ggvis Package: Create interactive plots using sliders, legends, and axes.
- Faceting in ggplot2: Understand the use of
facet_wrap()versusfacet_grid().
What You'll Learn:
- How to create visualizations with real-world datasets.
- Best practices for data visualization and graphic design principles.
- Advanced techniques in ggplot2, lattice, and interactive graphics with ggvis.
- Tips for handling complex datasets and creating meaningful plots.
- How to present your data effectively to stakeholders or the public.
What You'll Get:
- Lifetime Access: Study at your own pace with lifetime access to course materials.
- Regular Updates: Ensure you're learning the latest version of R and RStudio.
- Certificate of Completion: Receive an electronic certificate to add to your resume, CV, or LinkedIn profile from Udemy upon course completion.
Join Us:
Embark on a journey to enhance your data visualization and analysis skills with R. This comprehensive course covers everything you need to know to become proficient in creating impactful visualizations that can communicate complex stories effectively.
See you in the first lecture, and let's make data come alive together! 📊✨
Course Gallery


Loading charts...