R: Data Visualization with R - A Complete Guide!: 3-in-1

Why take this course?
📈 R: Data Visualization with R - A Complete Guide!
🚀 Course Headline: "Advanced visualization techniques in R to visualize 2D and 3D interactive plots!"
👀 Course Description: Data is at the heart of decision-making in business and analytics, and mastering data visualization can provide you with deep insights that are not immediately apparent. R is a powerful, open-source language for statistical computing and graphics, renowned for its data analysis capabilities. With R's versatility and robust libraries, data professionals can transform complex data sets into compelling visualizations.
🌟 Why This Course? If you are a data science professional looking to enhance your visualization skills or new to R and eager to learn, this 3-in-1 course is your gateway to unlocking the full potential of R for data visualization. It's designed to take you from the basics of plotting in R to creating sophisticated, interactive visualizations that can be embedded in websites or blogs.
📚 Course Content and Overview: This comprehensive course is divided into three distinct parts:
-
Learning R for Data Visualization:
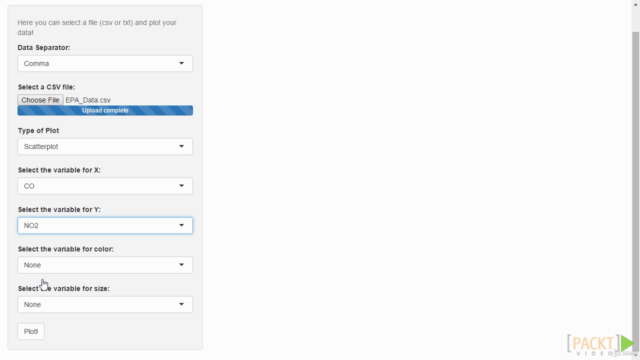
- Import data from various formats (CSV, Excel, etc.).
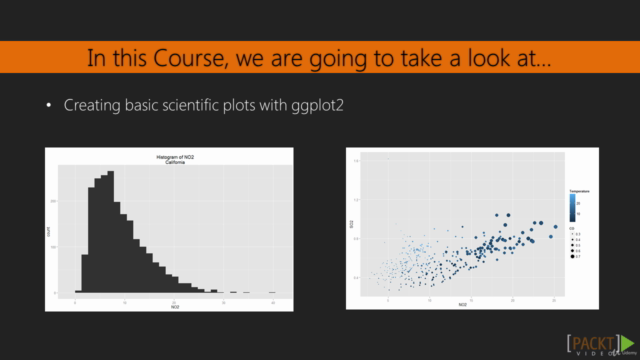
- Create basic plots like histograms, scatterplots, and more with default options for stunning visualizations.
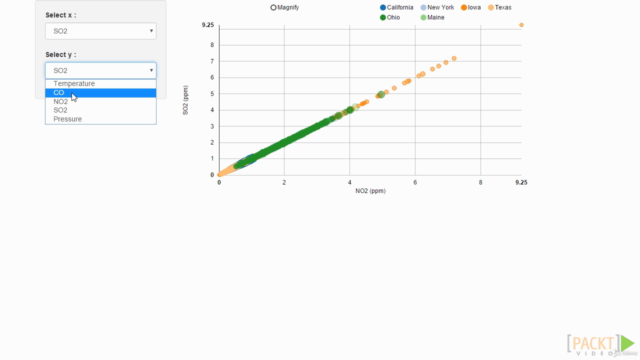
- Explore the Shiny package to build web-based interactive data applications.
- Learn to upload your work to a live website for sharing with peers and colleagues. 🔗 Revisit and apply concepts with an interactive project to create a complete website.
-
R Data Visualization - Basic Plots, Maps, and Pie Charts:
- Dive into the basics of R plots, heat maps, and customization.
- Create interactive maps using the googleVis package.
- Generate choropleth maps, contouring maps, bubble plots, and pie charts.
-
R Data Visualization - Word Clouds and 3D Plots:
- Learn about word clouds and 3D plotting in R.
- Interactive maps and visualizations with the googleVis package.
- Explore choropleth maps, contouring maps, bubble plots, and pie charts. 🔗 Master advanced techniques for interactive graphs, plots, and Pie charts as well as 2D and 3D visualizations.
🧐 Who Should Take This Course? This course is tailored for data professionals, analysts, and anyone interested in learning about the powerful data visualization capabilities of R. Whether you are new to R or an experienced user looking to expand your skill set, this course will guide you through a practical approach to creating impactful visualizations.
👩🏫 About the Authors:
-
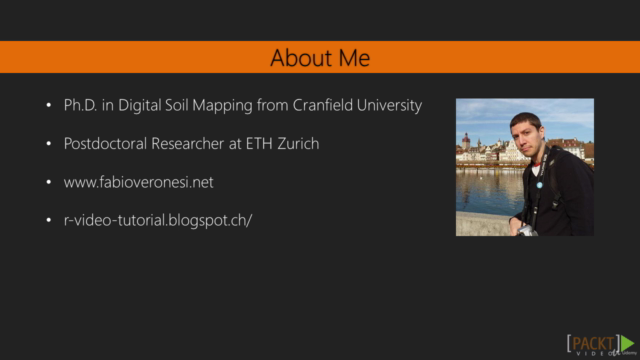
Fabio Veronesi holds a Ph.D. in digital soil mapping from Cranfield University and has worked as a postdoc at ETH Zurich, specializing in environmental research, including digital soil mapping, cartography, shaded relief, renewable energy transmission line siting, and the application of spatial statistical techniques to environmental data.
-
Atmajit Singh Gohil is a senior consultant based in New York City, with experience in the financial industry as a Fixed Income Analyst. He has a master's degree in financial economics from SUNY Buffalo and a Master of Arts in economics from the University of Pune, India. He writes about data manipulation, data exploration, visualization, and R plotting functions on his blog and enjoys hiking in his free time.
🎉 Enroll Now to Transform Your Data into Insightful Stories with R's Visualization Power!
Course Gallery


Loading charts...