R: Complete Data Visualization Solutions

Why take this course?
🌐 R: Complete Data Visualization Solutions
🚀 Course Headline: Learn by doing - use R’s most popular packages and functions to create interactive visualizations!
🎉 Course Description: Dive into the world of data visualization with R, a powerful open-source programming language that's a staple in the data science community. This course is meticulously crafted to guide you through every aspect of R's visualization capabilities, ensuring you emerge as a data visualization expert.
🎓 What You Can Expect:
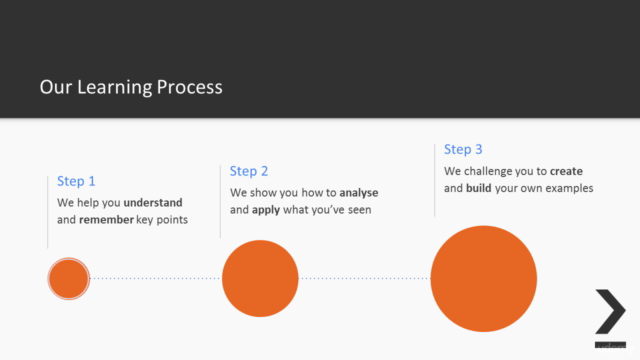
- Comprehensive Learning Experience: A rich mix of text, videos, code examples, and interactive assessments makes learning both engaging and effective.
- Structured Learning Path: Start with the basics and gradually move towards advanced topics in a modular format that lets you learn at your own pace.
- Real-World Application: Each concept builds upon the last, culminating in mastery of data visualization techniques in R. These modules can also serve as standalone resources for specific learning objectives.
📈 What You Will Learn:
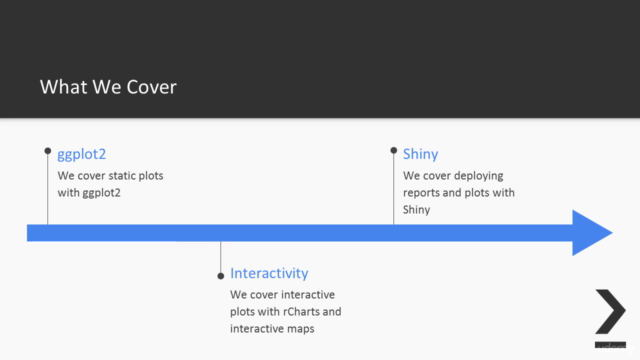
- Master "ggplot2" for creating advanced figures suitable for exploratory data analysis.
- Customize your plots to tell a compelling story with your data.
- Explore interactive plots, perfect for engaging audiences and stakeholders.
- Analyze time series data with tailored visualizations like heat maps and dendograms.
- Utilize mapping techniques, turning static maps into dynamic, interactive visualizations.
- Build an entire interactive report using the "ggvis" package.
- Learn how to publish your reports and plots using Shiny, making them accessible and interactive online.
- Visualize data in higher dimensions, opening up a new realm of possibilities for complex datasets.
🌍 Expert Insights: This course is authored by leading experts in their respective fields:
- Dr. Fabio Veronesi has extensive experience in environmental research, specializing in spatial statistical techniques and digital soil mapping.
- Atmajitsinh Gohil is a senior consultant with expertise in data manipulation, data exploration, and visualization using R.
- Yu-Wei, Chiu (David Chiu) is an entrepreneur and data scientist who founded LargitData, focusing on Big Data and machine learning. He's also an accomplished lecturer and speaker on the subject of R and Python in data science.
🛠️ Why This Course? R is becoming the preferred tool for data scientists, and this course prepares you to join the ranks of professionals who use R for their data science needs. Whether you're aiming to upskill, change careers, or simply enhance your current role, this course will equip you with the skills needed to excel in the field of data visualization using R.
📅 Enroll Now: Embark on a journey to become proficient in R's data visualization capabilities. Sign up for the "R: Complete Data Visualization Solutions" course today and transform your data into captivating visual stories! 📊✨
Course Gallery


Loading charts...