Quantitative Investment Analysis in Excel (Template Incl.)

Why take this course?
🚀 Course Title: Quantitative Investment Analysis in Excel (Template Incl.)
🎓 Course Headline: Master Excel to Model Investing Strategies; Learn to Back Test and Optimize Your Strategies with an Included Template!
✨ Course Description:
Are you ready to transform your approach to investing? 🤔 Dive into the world of Quantitative Investment Analysis and harness the full power of Microsoft Excel with our comprehensive course! Whether you're a seasoned investor or just starting out, this course will guide you through creating a robust quantitative investment model within Excel.
📊 What You Will Learn:
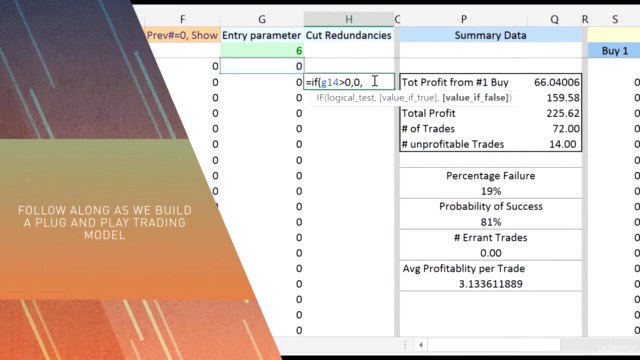
- Building Quantitative Models: Learn the intricacies of constructing investment models that can analyze and predict market trends using technical indicators.
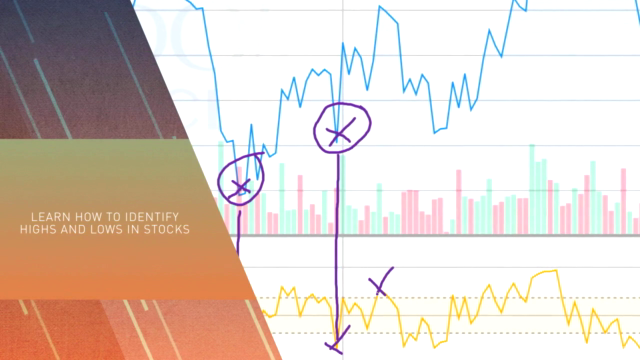
- Understanding Technical Indicators: Get hands-on experience with the Relative Strength Index (RSI) and other key indicators to identify high-probability trades.
- Back Testing Strategies: Simulate trading strategies over past data to evaluate their effectiveness before deploying them in live markets.
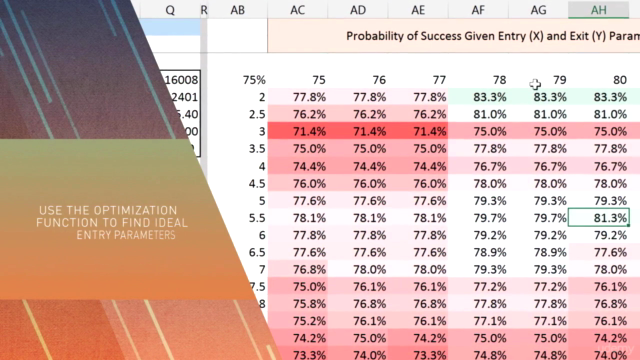
- Optimizing Trade Parameters: Fine-tune your buy and sell parameters to maximize profitability and minimize risk.
- Performance Analysis: Analyze the performance of your investment strategy, including success rates and average profitability per trade.
💫 Why This Course?
- Practical Excel Skills: Elevate your Microsoft Excel expertise by applying it to real-world investing scenarios.
- Includes a Comprehensive Template: We provide an investment modeling template that you can use immediately after the course, saving you hours of setup time.
- High Probability Success Rates: Learn how to adjust your trading strategy to achieve 80%-90% success rates in your trades.
📈 Course Features:
- Step-by-Step Guidance: From beginner to advanced, we'll take you through each step of the investment modeling process in an easy-to-follow format.
- Real-World Applications: Apply your new skills to any stock you choose, making it directly applicable to your personal investing goals.
- Exclusive Resources: Gain access to additional resources and support as you navigate through the course material.
🎯 Who This Course Is For:
- Aspiring or current investors looking to incorporate quantitative analysis into their investment strategy.
- Excel users who want to expand their expertise in financial modeling and data analysis.
- Anyone interested in learning how to make informed, data-driven trading decisions with the power of Excel.
🛠️ Take Control of Your Investments: Join us on this journey to master quantitative investment analysis using Excel. With our comprehensive course and included template, you'll have the tools and knowledge to back test your strategies and optimize your investments for success. Enroll now and step into the world of informed trading decisions! 🌟
Course Gallery


Loading charts...