Business Intelligence Layers Development Using Python
Why take this course?
📚 Course Title: Data Analytics and Visualization from Sources to Insight
🚀 Headline: Master Python's Role in Business Intelligence with Our Expert-Led Course!
Unlock the Power of Data with Our Comprehensive Online Course!
Embark on a transformative learning journey with our *"Data Analytics and Visualization from Sources to Insight" course. This expertly designed program is tailored to empower you with the essential skills and knowledge required to leverage data for strategic decision-making and insightful analysis within the realm of Business Intelligence.
🚀 What You Will Learn:
-
🔍 Data Sources Layer - Understanding Data Origins:
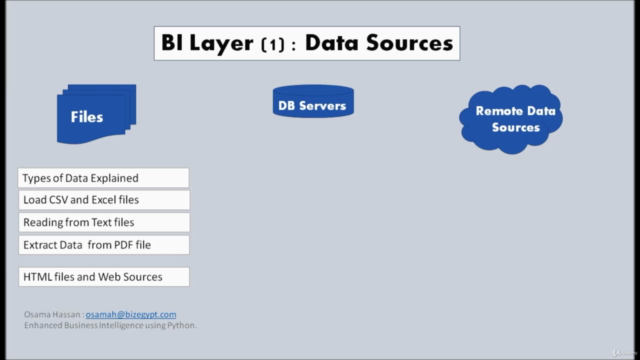
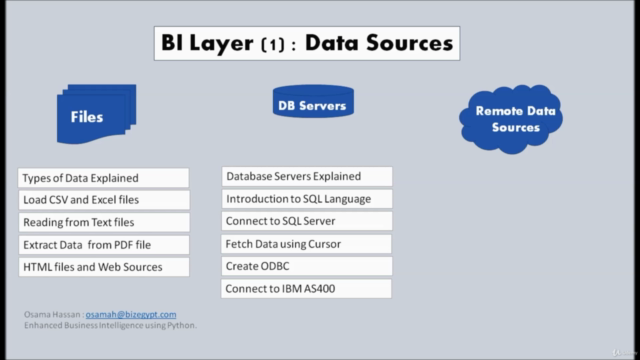
- Accessing data from diverse sources including No-SQL databases, CSV files, spreadsheets, text, HTML, and PDF documents.
- Connecting to database servers and querying remote datasets.
-
🧰 Data Preparation Layer - ETL - Transforming Data into Actionable Insights:
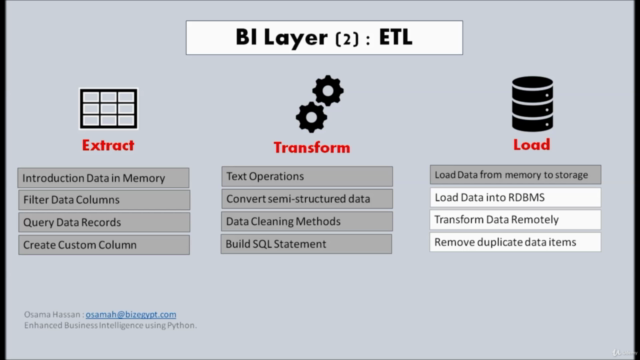
- Mastering data frames manipulation.
- Handling complex data types such as strings, dates, and times.
- Learning advanced data transformation techniques like Oracle PL SQL for remote operations.
-
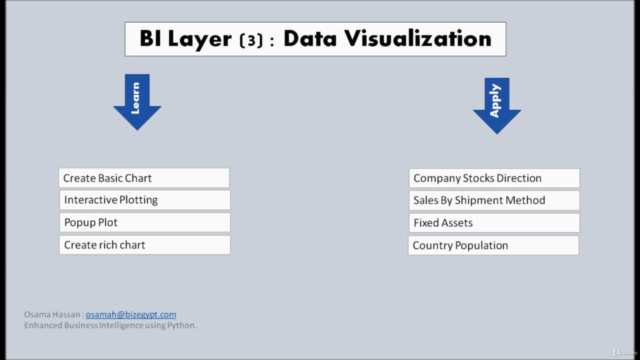
📊 Data Visualization - Bringing Data to Life:
- Creating both static and interactive charts with ease.
- Analyzing customer behavior through impactful visualizations.
- Gaining insights from data sets to inform business decisions.
-
📈 Data Analytics - Diving into the Core Analysis:
- Understanding the complete cycle of data analysis.
- Grasping fundamental statistics and applying them in real-world scenarios.
- Exploring predictive modeling through linear regression and linear programming.
- Analyzing securities with comprehensive case studies.
-
🤝 Data Sharing - Collaborative Data Solutions:
- Setting up Python servers and configuring Jupyter Notebook servers in a LAN environment.
- Enhancing security for notebook servers.
- Integrating HTML and external web sources into Python scripts to share data effectively.
-
📊 Business Intelligence Context - Applying Your Skills in Real-World Scenarios:
- Exploring the context of business intelligence within Python.
- Identifying different types of data and their significance.
- Extending Python scripts to Power BI for a deeper dive into Excel, SQL Server, and web data sources.
Who Is This Course For?
This course is designed for individuals at all levels of expertise:
- Aspiring analysts looking to break into the field of data analytics.
- Current professionals seeking to expand their Python skills within the business intelligence domain.
- Data enthusiasts aiming to understand the end-to-end process of data analysis and visualization.
🎓 Key Takeaways:
- A solid foundation in data analytics, preparation, and visualization using Python.
- Practical experience with real-world examples and case studies.
- The ability to connect data from various sources and prepare it for insightful analysis.
- Skills to create compelling visualizations that tell a story.
- Knowledge of how to share and collaborate on data within a business intelligence context.
By the end of this course, you'll be equipped with the tools and knowledge to transform raw data into actionable insights and drive strategic decision-making for your organization. Join us now and take the first step towards becoming a data analytics expert! 🌟
Course Gallery
Loading charts...