Python Matplotlib Crash Course for Data Visualization

Why take this course?
🚀 Python Matplotlib Crash Course for Data Visualization (2024) 📊
Course Headline: 🎯 "Learn Matplotlib Concepts with Hands-On Live Running Coding Examples and Exercises"
Welcome to the Matplotlib Course for Beginners by Studyopedia! 🎉
Dive into the world of data visualization with Python's powerful Matplotlib library. Matplotlib is an open-source plotting library developed by John D. Hunter, designed for embedding plots into applications using general-purpose GUI toolkits like Tkinter, wxPython, Qt, or PyGame. It is built on NumPy and is one of the most popular libraries for data visualization in Python.
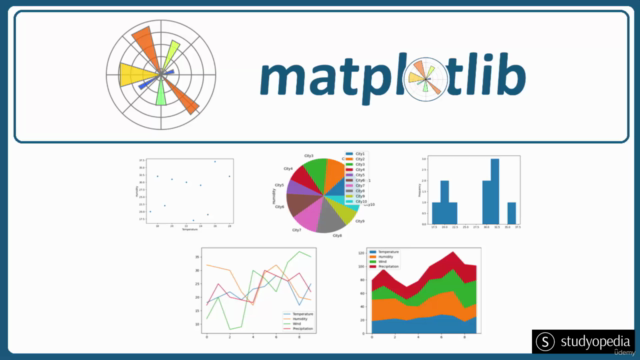
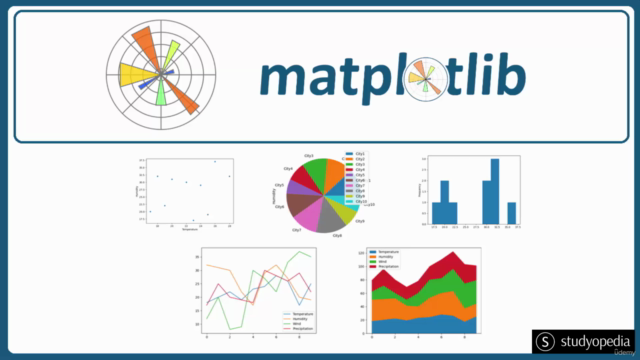
With Matplotlib, you can create interactive visualizations that make understanding your data easier and more engaging. Visualizations are far better than textual data; they enable us to easily create graphs, histograms, bar graphs, and much more.
Features of Matplotlib: ✨
- Free and Open-Source: Accessible to all for personal and commercial use.
- Easy Data Loading and Plotting: Simplifies the process of converting data into visual representations.
- Interactive Figures: Includes zoom, pan, and update capabilities.
- Export to Various Formats: Easily export your plots as PNG, PDF, SVG, etc.
- Extensible with Third-Party Packages: Enhance your plotting capabilities with additional packages built on Matplotlib for animations, styles, and more.
- Customizable Graphs: Create graphs with legends, position titles, and much more using Matplotlib's robust set of tools.
Course Lessons: 📚
-
Matplotlib – Introduction Get familiar with the basics of Matplotlib and its potential.
-
Install & Matplotlib Learn how to set up your environment for Matplotlib plotting.
-
Matplotlib - PyPlot Submodule (Run first Matplotlib program) Execute your first Matplotlib script and explore the
pyplotsubmodule. -
Matplotlib - Plotting Master the art of creating static plots, including lines, text, and images.
-
Matplotlib - Add Grid Lines Enhance your plots with grid lines for better data comprehension.
-
Matplotlib - Add Labels to a Plot Annotate your plots with customizable labels and descriptions.
-
Matplotlib - Plot Titles and Position them Create engaging titles and position them according to your preference.
-
Matplotlib - Add a Legend in a Graph Learn how to add legends and manage them effectively.
-
Matplotlib - Position Legends Fine-tune the placement and appearance of legends in your plots.
-
Matplotlib - Change the background color of the Legend Customize the legend's background for a unique and clear presentation.
-
Matplotlib - Change the font size of the Legend Adjust the font size to ensure legibility and clarity.
-
Matplotlib – Bar Graph Generate bar graphs to compare different data points at a glance.
-
Matplotlib – Pie Chart Represent proportions with visually appealing pie charts.
-
Matplotlib – Line Graph Analyze trends over time with line plots.
-
Matplotlib – Histogram Explore the distribution of data using histograms.
-
Matplotlib – Scatter Plot Visualize relationships in your dataset with scatter plots.
After completing the lessons, put your skills to the test with our provided Online Quizzes. These quizzes are designed to reinforce what you've learned and help you master Matplotlib for data visualization in Python.
Hit the Enroll Button and start your journey into data visualization with Python's Matplotlib library! 🛣️✨
Don't miss out on this opportunity to enhance your data visualization skills using one of the most versatile plotting libraries available. Sign up now and transform the way you present and analyze data with Python Matplotlib!
Course Gallery


Loading charts...