Python for Data Analysis & Visualization
Why take this course?
🎉 Python for Data Analysis & Visualization 📊💻
Master the Art of Data with Python!
Dive into the world of data analysis and visualization with our comprehensive online course. Python is not just a programming language; it's a gateway to understanding complex datasets and transforming them into meaningful insights and stunning visualizations. 🧠✨
Course Structure:
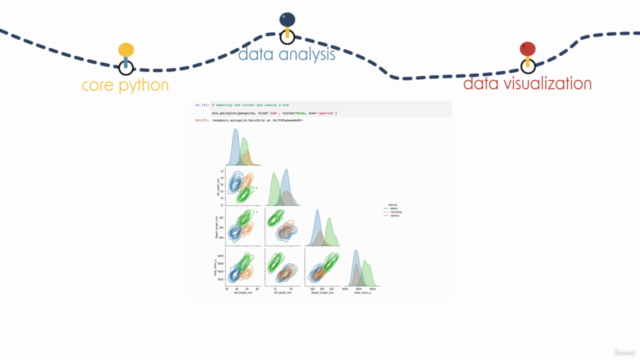
This course is expertly designed to cater to all levels of students, whether you're a beginner or an experienced programmer. It's split into three key areas:
-
Core Python3 Mastery: 🐍
- Grip the fundamentals of Python, including objects, variables, data types, control flow, loops, and functions to ensure you have a strong foundation for working with libraries in this course.
-
Data Analysis & Manipulation: 📈
- Conquer NumPy and Pandas, two of the most powerful libraries for numerical and data manipulation. You'll learn how to connect to various data sources and perform sophisticated data analysis.
-
Data Visualization Techniques: 🖼️
- Unleash your creativity with Matplotlib, Seaborn, and Plotly Express to create compelling data visualizations that can tell a story or highlight important patterns in the data.
Hands-On Learning Experience:
-
Jupyter Notebooks: 📝 Learn using Jupyter Notebooks within the Anaconda Distribution, the most popular integrated development environment (IDE) for Python and data science.
-
Rich Media Content: 🎬 Engage with a variety of lectures, code-along videos, and interactive coding exercises designed to reinforce your learning experience.
-
Challenge Sections: 🏆 Put your skills to the test with numerous challenge sections that use real-world datasets to apply the external libraries you've learned.
What You'll Get:
-
Lifetime Course Access: 🔄 You'll have unlimited access to all lectures, ensuring you can revisit any section and reinforce your learning at no additional cost.
-
Downloadable Resources: 📚 Benefit from detailed course resources, including downloadable Notebooks that will accompany you throughout the course.
Why Choose This Course?
-
Proficiency in Python: 🚀 The primary goal is to make you proficient in Python and its libraries for data analysis and visualization.
-
Versatility Across Platforms: 🖫️⚙️ Suitable for students of all levels, regardless of the operating system they use.
Curriculum at a Glance:
-
Set Up & Installation: 🛠️ Get your environment ready with the necessary setups and installations.
-
Core Python: 🧪
- Python Objects, Variables, and Data Types: Learn about the basic building blocks of Python.
- Control Flow and Loops: Master decision-making in code and iterative patterns.
- Functions: Understand how to create and use functions effectively.
-
External Libraries: 📦 Discover the power of external libraries that extend Python's capabilities.
-
Data Analysis Libraries: 🔗
- NumPy: Get to grips with numerical computing in Python.
- Pandas: Learn how to handle and analyze data like a pro.
- Connecting to Data Sources: Gain skills to connect your data analysis to various sources.
-
Visualization Libraries: 🖼️✨
- Matplotlib: Dive into the essentials of plotting with this go-to library.
- Seaborn: Enhance your visualizations with a high-level interface for drawing attractive and informative statistical graphics.
- Plotly Express: Create interactive, publication-quality graphs online or in local environments.
-
4 Dedicated Challenge Sections! 🏗️ Apply your newfound knowledge to solve real-world problems and datasets, solidifying your understanding and skills.
Embark on a journey to become a data analysis and visualization expert with our Python for Data Analysis & Visualization course. Sign up today and transform the way you handle and present data! 🚀💫
Course Gallery
Loading charts...
Comidoc Review
Our Verdict
This Python for Data Analysis & Visualization course on Udemy offers comprehensive coverage of key data analysis and visualization libraries in Python, making it a valuable resource for those wanting to hone their skills in this domain. While the clear teaching style is refreshing, deeper conceptual understanding could be aided through more thorough explanations and an even distribution of challenges throughout lectures. Adjusting volume settings and seeking further clarification when needed ensures the best outcome for learners.
What We Liked
- Covers a wide range of data analysis and visualization libraries in Python including Numpy, Pandas, Matplotlib, Seaborn, Plotly among others
- Instructor is concise, clear and to-the-point, making it easy to follow along
- Real-world examples and exercises help reinforce concepts and make them more tangible
- Includes Coding Challenges which enable deeper learning of topics
Potential Drawbacks
- Lacks depth in explaining certain concepts or theory, making it difficult for beginners to grasp ideas without prior knowledge
- Coding challenges could be more evenly distributed throughout the course
- Volume of lectures can sometimes be too low and requires adjusting external settings
- Occasionally, lacks proper explanation, leaving students confused (e.g., Seaborn section)