Python Data Visualization with Matplotlib 2.x

Why take this course?
🎓 Python Data Visualization with Matplotlib 2.x: By Example
Course Headline: 🚀 Explore the world of amazing and efficient graphs with Matplotlib 2.x to make your data more presentable and informative!
Course Description
Big data analytics are not just a buzzword; they are driving innovations across various domains including scientific research, digital marketing, policy-making, and beyond. The power of Matplotlib lies in its simplicity and versatility, making it an indispensable tool for anyone looking to visualize complex datasets. 📊 Matplotlib 2.x By Example delves into the methods and applications of various plot types through engaging real-world examples.
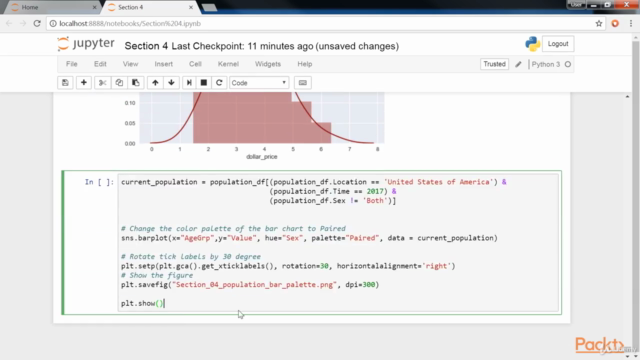
From the outset, this course will guide you through the basics of creating and customizing plots in Matplotlib. You'll then explore the intricacies of plotting different types of economic data, both in 2D and 3D, to extract meaningful insights from vast public datasets like Quandl Finance. The course also covers the visualization of geographical data on maps and the creation of interactive charts, which are essential for dynamic storytelling with data.
By the end of this video course, you'll be well-versed in leveraging Matplotlib for advanced data visualization in your daily work. You'll learn to prepare high-quality figures suitable for manuscripts and presentations, and you'll gain the skills to create intuitive infographics that succinctly convey your message.
About the Author
Aldrin Kay Yuen Yim is a PhD student in computational and system biology at Washington University School of Medicine, with a track record of groundbreaking research in big data analytics and bioinformatics. His work has led to significant discoveries, including the identification of a novel major allergen class and the analysis of salt-tolerance genes in soybeans. Aldrin's current research interests revolve around neurodevelopment and gender dimorphism in brain cancers. He is also the founding CEO of Codex Genetics Limited, which provides personalized medicine services in Asia.
Allen Chi Shing Yu, a Chevening Scholar and MSc student at the University of Oxford, holds a PhD degree in Biochemistry from the Chinese University of Hong Kong. With over 10 years of experience in bioinformatics and big data analysis, Allen has published extensively in scientific research articles and presented at international conferences. He is the co-founder of Codex Genetics Limited, which offers personalized medicine services utilizing cutting-edge genomics technology.
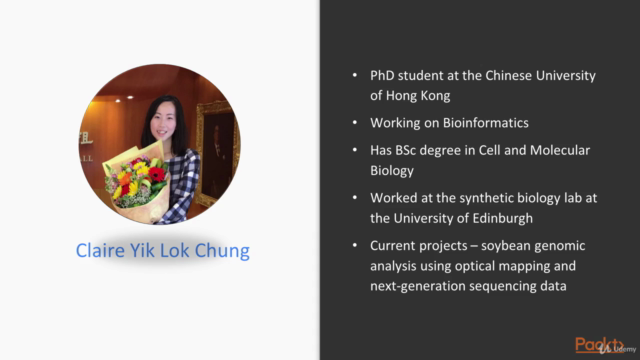
Claire Yik Lok Chung, a PhD student at the Chinese University of Hong Kong, majors in Bioinformatics and has a BSc degree in Cell and Molecular Biology. Her passion for scientific research spans across three labs, including the synthetic biology lab at the University of Edinburgh. With a decade of programming experience under her belt, Claire employs Python and Matplotlib to solve bioinformatics challenges and brings convenience to everyday tasks. She is also an expert in IT trends, graphic design, and multilingual translation, skills she finds incredibly transferable in her work.
Join us on this data visualization journey with Matplotlib 2.x By Example, and transform the way you present and understand your data! 📈✨
Course Gallery


Loading charts...