Python+data analysis and visualization Hands-on Training
Why take this course?
🚀 Course Title: Python+Data Analysis and Visualization Hands-On Training 📊💻
Course Headline: Master Python Fundamentals & Libraries for Data Analysis 🚀
Course Description:
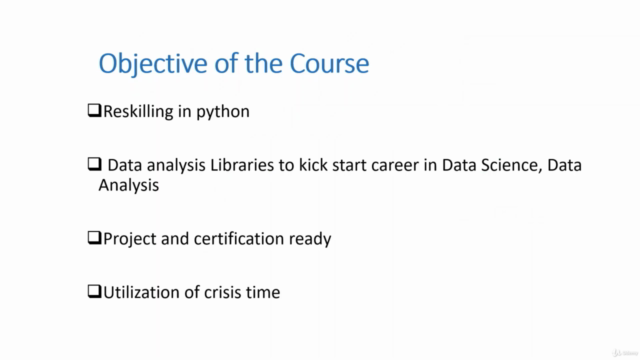
Embark on a comprehensive journey to master Python, the versatile programming language, and its powerful libraries like Numpy, Pandas, Matplotlib, and Seaborn for data analysis and visualization. This course is designed with a focus on practical applications, ensuring that you not only understand the concepts but can also implement them effectively to analyze and visualize data.
We start with the basics of Python and gradually delve into advanced topics. Each concept is explained with relevant examples and accompanied by practical exercises to solidify your understanding. By the end of this course, you will be equipped with the skills to handle real-world data analysis tasks with ease.
What You Will Learn:
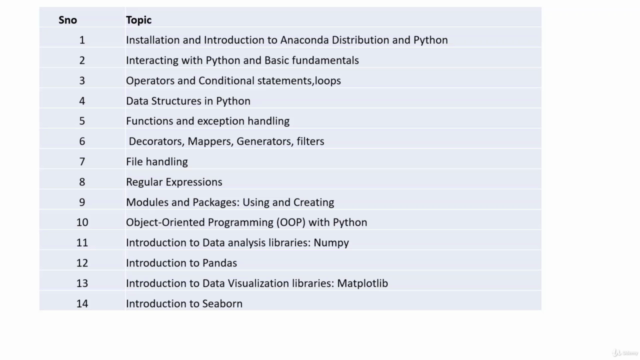
✅ Python Installation & Introduction: Get started with Anaconda Distribution – the powerful Python environment.
✅ Python Fundamentals: Understand data types, variables, operators, and basic programming constructs like loops and list comprehensions.
✅ Control Structures: Master conditional statements and loops to control the flow of your programs.
✅ Data Structures: Learn about Python's built-in data structures and how to use them effectively.
✅ Functions & Exception Handling: Write reusable functions and handle exceptions gracefully.
✅ Advanced Python Concepts: Explore decorators, mappers, generators, filters, file handling, and regular expressions.
✅ Modules & Packages: Learn to utilize and create your own modules and packages for modular programming.
✅ Object-Oriented Programming (OOP): Dive into the principles of OOP in Python.
Data Analysis and Visualization Libraries:
🔢 Numpy: Learn to perform large, multi-dimensional array operations and matrix manipulations.
📊 Pandas: Handle and analyze data with Pandas' powerful data structures like Series and DataFrames.
📈 Matplotlib: Create a variety of static, animated, and interactive plots to visualize your data.
🎨 Seaborn: Discover the art of plotting with Seaborn, which streamlines the process of creating complex plots.
Course Features:
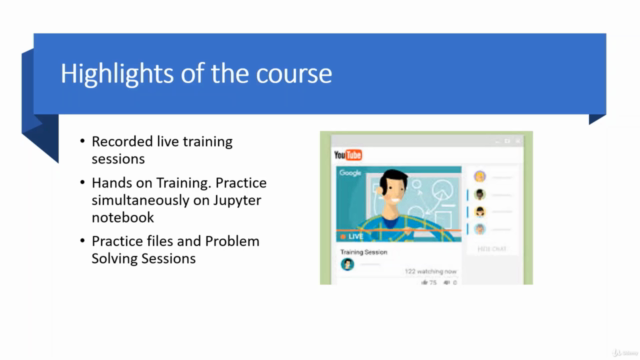
✨ Hands-On Training: Engage with live recorded sessions that offer a clear understanding of each concept.
📚 Relevant Examples & Practice Exercises: Apply what you learn with practical examples and exercises.
🗣️ Discussions on Practice Exercises: Learn from the discussions of practice exercises in the recorded sessions.
Join us to turn your passion for data into actionable insights with Python! 🐍✨ Whether you're a beginner or looking to enhance your skills, this course provides the perfect blend of theory and practical application to make you proficient in Python and its libraries for data analysis and visualization. Enroll now and unlock the power of data with Python!
Course Gallery
Loading charts...