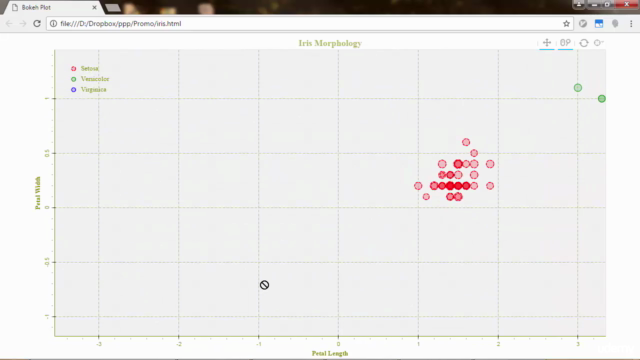
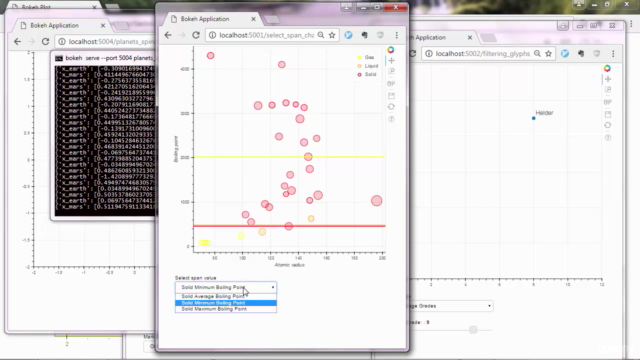
Interactive Data Visualization with Python and Bokeh

Why take this course?
Course Title: Interactive Data Visualization with Python and Bokeh 📊✨
Headline: A Complete Guide on Creating Beautiful Plots and Data Dashboards on the Browser Using the Python Bokeh Library
Course Description:
Are you ready to take your data visualization skills to the next level with Python? If so, you've found the right course! "Interactive Data Visualization with Python and Bokeh" is meticulously designed for anyone eager to create captivating plots and robust data dashboards that operate seamlessly in web browsers.
Why Choose This Course? 🚀
- Industry-Relevant Skills: Master the art of data visualization with Bokeh, a powerful library that's gaining popularity in the tech industry for its interactive and real-time data visualization capabilities.
- Practical Application: Learn to build web applications that allow users to interact with your plots directly from their browsers. This is not just about pretty graphs; it's about making data accessible and understandable through dynamic, responsive interfaces.
- Versatile Learning: Whether you're a data analyst, scientist, or statistician, this course equips you with the tools to present your data in a way that captures attention and communicates insights effectively.
- Real-World Data: Work with various datasets to apply what you learn and solidify your skills through practical application.
What You'll Learn: 🎓
- Understanding Bokeh: Start with the basics of Bokeh, learning its architecture and capabilities.
- Plotting Data: Transition from plotting simple datasets to creating complex, interactive visualizations.
- Building Dashboards: Construct sophisticated data dashboards that offer a rich user experience.
- Interactive Components: Integrate widgets and tools to make your visualizations more interactive and user-friendly.
- Real-Time Data Visualization: Learn how to plot data in real-time, keeping your visualizations up-to-date with live datasets.
- Deployment and Sharing: Understand the process of deploying your Bokeh applications for use on the web and sharing them with clients or teams.
Who Is This Course For? 👥
- Data Analysts & Scientists
- Statisticians
- Software Developers
- Business Intelligence Professionals
- Academics & Researchers
- Any professional dealing with data who wants to communicate their findings more effectively
Course Format: 🖥️
- Interactive Lectures: Engage with content that's as interactive as the visualizations you'll learn to create.
- Hands-On Exercises: Apply your knowledge with practical exercises designed to reinforce learning and test your skills.
- Data Samples & Examples: Get access to diverse datasets to experiment with, ensuring a comprehensive understanding of Bokeh's capabilities.
- Flexible Learning Schedule: Complete the course at your own pace, with an estimated time commitment of 10-20 hours per week over four weeks.
By the end of this course, you'll have the skills to: 🚀
- Effortlessly create beautiful and interactive visualizations using Bokeh.
- Develop web applications that visualize data in real-time with user interaction capabilities.
- Share your findings effectively by presenting them through compelling visual interfaces.
- Impress clients and colleagues with advanced Python visualization skills.
Join us on this journey to transform the way you visualize and understand data with Bokeh! 🌟
Enroll now and embark on a journey to become an expert in interactive data visualization with Python and Bokeh. Your next breakthrough is just a few clicks away!
Course Gallery


Loading charts...
Comidoc Review
Our Verdict
Interactive Data Visualization with Python and Bokeh proves to be a well-rounded course for those interested in creating stunning, interactive plots using the Bokeh library. Covering both theory and applications, it provides practical experience through exercises while being mildly affected by some deprecated code and minor presentation issues. Though facing stiff competition from Bokeh's own swift updates, this course remains relevant due to its focus on essential building blocks, embedding, and deployment techniques. All in all, an excellent starting point with the occasional need for deeper investigation when encountering discrepancies.
What We Liked
- Thorough exploration of Bokeh's features and capabilities
- Real-time data plotting through dynamic graph tutorials
- Practical exercises that reinforce learned concepts
- Valuable insights on integrating data visualization with Flask apps
Potential Drawbacks
- Some code samples are deprecated due to Bokeh's rapid updates
- Occasional discrepancies between actual and expected outcomes in lessons
- Minor issues with video focus and audio clarity
- Limited explanation of passing data/info between multiple widgets