Professional Dashboards in Excel and Tableau

Why take this course?
🎓 Complete Dashboards: Mastering Excel & Tableau 📊
What You’ll Learn in This Course? Explore the art of data visualization with our comprehensive course, "Professional Dashboards in Excel and Tableau." This isn't just a set of lessons; it's a transformative journey into the world of professional reporting.
Why Take This Course?
- Elevate Your Data Skills: Learn to create visually compelling reports with both Excel and Tableau, two of the most powerful tools for data analysis.
- Career Advancement: Dynamic visual reports are at the heart of modern business interactions. Mastering dashboards can position you as an invaluable asset to your team and company.
- Professional Development: From creating reports from scratch to interpreting them with ease, this course will elevate your proficiency in data visualization, a skill highly sought after by strategic teams.
Course Highlights:
- Introduction to Data Visualization: We'll dive into the main principles of data visualization, including color theory and selecting the right visualizations for your data. Discover online platforms that can enhance your data journey.
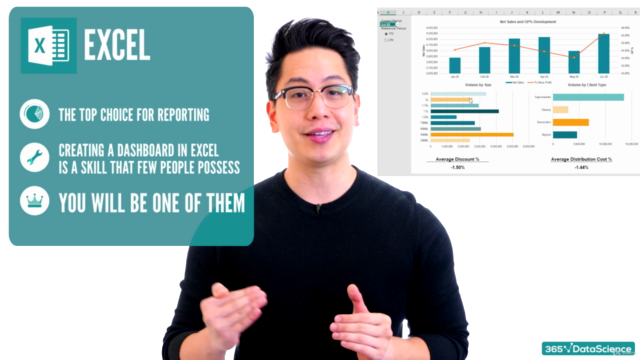
- Excel Dashboard Creation: Learn the entire process of making a dashboard in Excel using real-world data from the FMCG industry. Apply our professional color template to give your reports a cohesive, polished look.
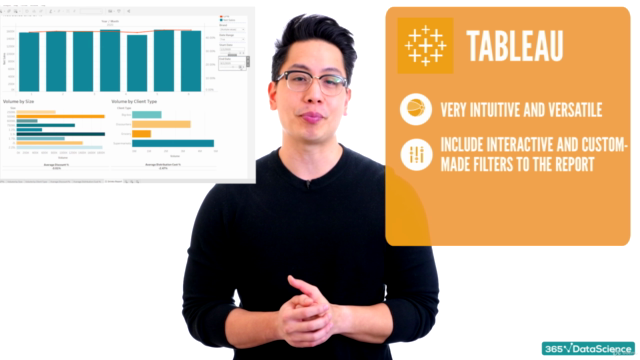
- Tableau Dashboard Mastery: We'll guide you through building charts and other elements in Tableau with data from the same industry sector. Get hands-on experience with a range of techniques that will make your dashboards stand out.
Practical Skills You’ll Gain:
- Custom Time Filters: Discover how to add custom time filters to your Excel and Tableau reports, enabling you to analyze time series data more effectively.
- Filter Design & Styling in Tableau: Learn the ins and outs of creating and styling filters in Tableau. Even beginners will quickly become proficient in designing dazzling charts and reports.
Who is This Course For?
- Aspiring professionals looking to level up their career with data visualization skills.
- Anyone aiming to improve their Excel and Tableau skills for better job prospects.
- Individuals interested in learning dynamic visualization techniques to present data more effectively.
- Those seeking a career in business intelligence or analytics and want to stand out with advanced reporting capabilities.
What’s Inside the Course?
- Comprehensive Lessons: From the basics of data visualization to advanced techniques in Excel and Tableau, our course is designed to cover all aspects of professional dashboards.
- Real-World Data: Learn with real-world datasets that mirror the kind of data you'll encounter in your career.
- Professional Color Template: Access a beautiful color template that you can use to make your future reports look professional and cohesive.
- Hands-On Practice: Apply what you learn directly to your assignments, ensuring you become proficient with these tools.
By the end of this course, you will be equipped with the knowledge and skills to create compelling dashboards that can turn data into insights and drive decision-making in any business context.
Don’t miss the opportunity to transform your approach to data and analytics. Enroll in "Complete Dashboards: Mastering Excel & Tableau" today and take a significant step towards advancing your career! 🚀📈
Course Gallery


Loading charts...