Presenting Financials with Excel and PowerPoint

Why take this course?
🌟 Master Financial Presentations with Excel & PowerPoint! 🌟
Course Title: Presenting Financials with Excel and PowerPoint
Headline: Become a Data Presentation Pro for "Numbers People"!
Welcome to the ultimate course for financial maestros, analysts, and anyone who wants to transform raw data into compelling stories. In this course, Learnit Anytime, you'll learn special tricks in Excel and PowerPoint that are tailored for presenting to "numbers people". Whether you're dealing with spreadsheets daily or preparing for the next big financial presentation, this course will elevate your skills.
Why Take This Course? 📈
- Unlock Data Insights: Learn how to use Excel to analyze and interpret complex data sets easily.
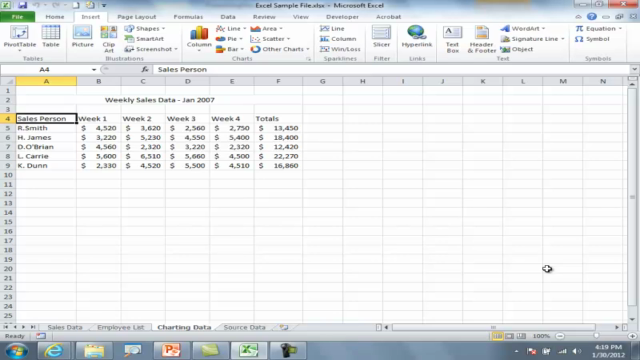
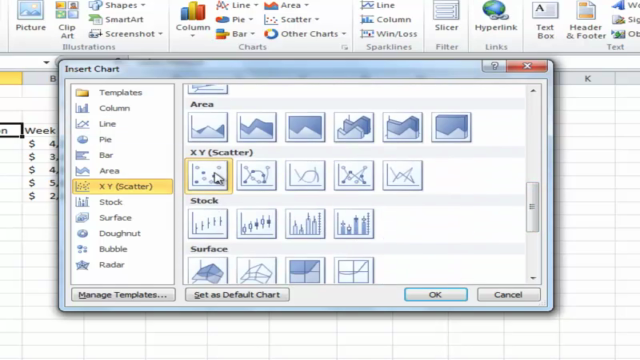
- Visualize Your Data: Create professional, informative charts in Excel that bring your numbers to life.
- Craft Engaging Presentations: Use PowerPoint to design slides that complement your financial analysis and captivate your audience.
- Impress Stakeholders: Share insights with clarity and confidence using both Excel and PowerPoint.
- Save Time and Effort: Automate repetitive tasks and streamline your presentation preparation process.
What You'll Learn 🎓
Excel Mastery for Financial Data:
- Data Analysis Techniques: Master PivotTables, Functions & Formulas that simplify complex data.
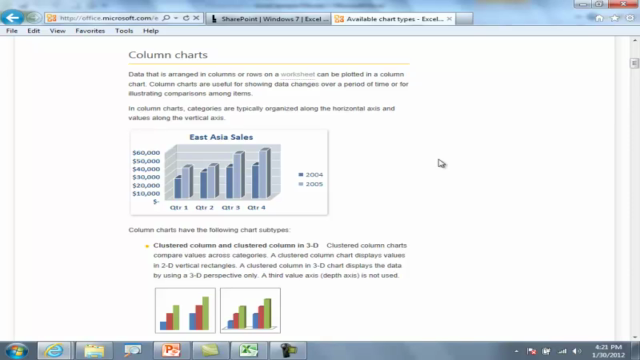
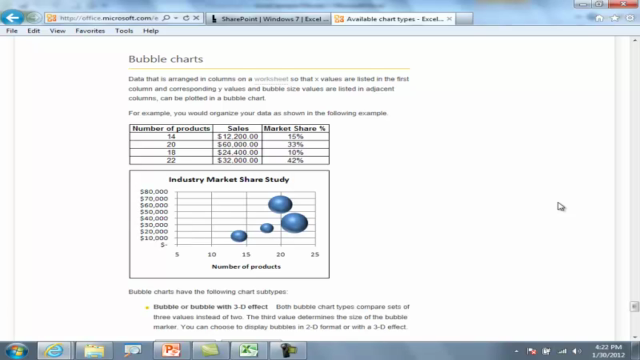
- Chart Wizardry: Turn numbers into visually appealing charts and graphs with the right design elements and colors.
- Advanced Charting: Discover how to create dashboards that provide a high-level overview of your financial data.
PowerPoint Presentation Skills:
- Design Principles: Learn to create beautifully designed slides that maintain your audience's attention.
- Data Integration: Effortlessly import Excel charts into PowerPoint and format them for maximum impact.
- Professional Storytelling: Use animations, transitions, and notes features to guide your presentation smoothly.
Course Structure 🗓️
The course is structured into clear modules:
- Getting Started with Excel: Understanding the basics and setting up for success.
- Data Analysis Techniques in Excel: Diving deep into data, with a focus on financial scenarios.
- Charting with Precision: Creating charts that are both visually appealing and accurate.
- PowerPoint Presentation Design: Laying the groundwork for a captivating presentation.
- Integrating Excel Data into PowerPoint: Combining your data visualization expertise with a powerful presentation.
- Advanced Tips & Tricks: Tailoring your presentation to resonate with "numbers people".
- Final Project: Bringing it all together for a complete financial presentation.
Who This Course Is For 🎯
- Financial Analysts, Accountants, and CFOs
- Business Students and Aspiring Data Scientists
- Sales and Marketing Professionals
- Project Managers
- Any individual who wants to enhance their data presentation skills!
Ready to turn your financial insights into persuasive presentations? Enroll in Presenting Financials with Excel and PowerPoint today and transform the way you communicate data. 🚀
Sign up now and join a community of learners who are ready to master the art of presenting financials with confidence! 💡✨
Course Gallery


Loading charts...