Hands-On Tableau Projects - Build 3 Dashboards from Scratch

Why take this course?
🌟 Tableau Crash Course with Real Projects & Hands On Learning 🌟
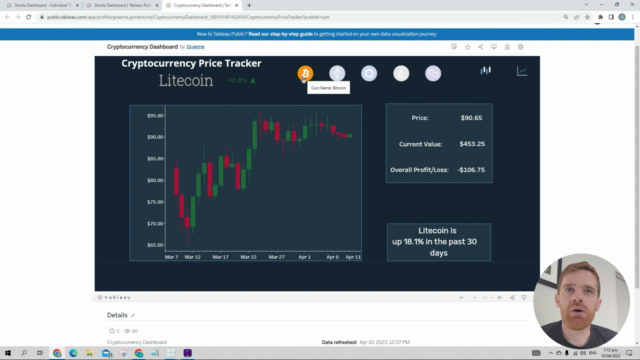
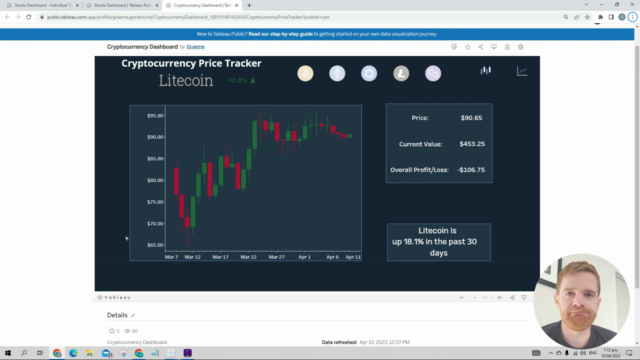
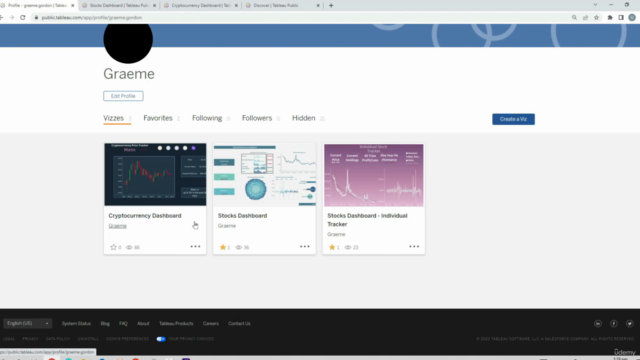
🚀 Course Headline: Create and Design 3 of your own automated dashboards - two stock performance and one cryptocurrency!
Welcome to the World of Data Visualization with Tableau! 🌍
Are you ready to dive into the exciting realm of data visualization? Whether you're a budding data analyst or simply looking to master the art of turning raw data into compelling stories, this course is your golden ticket! 🎫
With Tableau as your tool of choice, you'll embark on an adventure through the core concepts and advanced features that will transform the way you handle and represent data. This is not just a course; it's a journey to becoming a data visualization expert with practical, hands-on experience.
Course Description:
This comprehensive Tableau Crash Course is designed to take you from a beginner to an advanced user by working on real-world projects. You'll start by learning the essentials of connecting to various data sources and end with the skills to publish your own interactive dashboards.
Here's what you can expect to learn:
📊 Data Visualization using Tableau public
- Master a range of visualizations, including Donut Chart, Line Chart, Area Charts, Lollipop Chart, Bubble Chart, and more!
🔢 Calculated Fields
- Learn to create new fields by performing calculations on your existing data set.
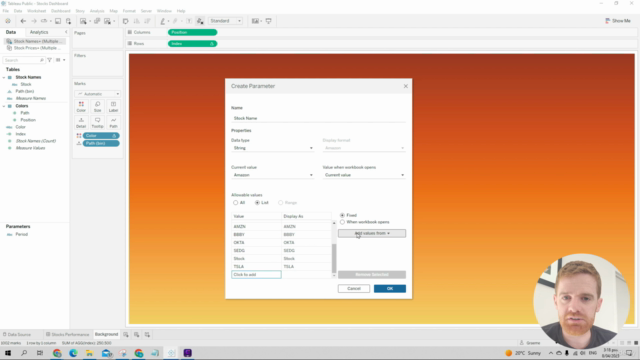
⚙️ Parameters
- Use workbook variables to filter your data based on specified conditions for a dynamic user experience.
📊 Connect to Data Source
- Connect effortlessly with Google Sheets and set them up for automatic refreshes using Google Apps Script.
🔀 Conditional Statement
- Get familiar with conditional statements by creating IF/ELSE functions within Tableau.
🎨 Tiled and Floating Dashboard Design
- Experiment with different layout styles in dashboard design, from tiled to floating, to understand the best presentation for your data.
⚛️ Sets
- Discover how to use sets to highlight top stocks by holdings.
🔍 Tooltips
- Learn to display additional information when users hover over elements in your dashboard.
📈 Custom Icons & Navigation Links
- Enhance your dashboards with custom icons and navigation links to provide a smoother user experience.
📊 Trend Lines
- Make it easier to identify trends in your line charts by adding trend lines.
...and much, much more!
Unlock Your Potential with Tableau 🎯
By enrolling in this course, you'll gain the skills to create dynamic and visually stunning dashboards for stock and cryptocurrency performance tracking. These dashboards will not only look impressive but also aid in making data-driven decisions effectively.
This course is perfect for anyone from marketers and small business owners to finance professionals and beyond. It doesn't matter if you have no prior experience with Tableau or if you're looking to solidify your existing knowledge – this course has you covered!
Note: The dashboards created in these projects are for educational purposes only. They are not financial advice, and I do not recommend buying any stocks shown in the dashboard examples.
Join now and let's turn your data into a compelling narrative with Tableau! 📊✨
Enroll today and start your transformation into a data visualization pro! 🚀💻
Course Gallery


Loading charts...