Statistics 2025 A-Z™: For Data Science with Both Python & R

Why take this course?
🎉 Statistics 2024 A-Z™: For Data Science with Both Python & R 🎉
Are you ready to embark on an exciting journey into the world of Data Science and Business Analysis? If you're a beginner or an analytics professional looking to solidify your understanding of statistics, this is the course for you! 🌍📊
Course Headline
Beginner to Expert Guide for Data Science and Business Analysis with Case Studies and Hands-on Exercises Using Python & R
Course Description
Data Science and Analytics are at the forefront of solving some of the most intriguing challenges across various industries. Statistics serve as the bedrock for all forms of analysis, including machine learning models, and mastering it is crucial for any aspiring data scientist or business analyst. 🧐✨
For many, statistics can be an intimidating subject, often met with skepticism and doubts. This comprehensive course is designed to demystify statistics, providing you with a complete toolkit for understanding and applying statistical methods effectively. We've tailored this curriculum to ensure that you have all the necessary knowledge right from the start of your learning journey. With our expert guidance, you can avoid the common pitfall of revisiting basic concepts later on.
What This Course Offers 🚀
- Full-fledged Knowledge of Statistics: We cover every essential topic in great detail!
- Real-World Applications: Learn how and why statistics are vital in real-world scenarios.
- Comprehensive Coverage: From the basics of descriptive statistics to advanced inferential techniques, we've got you covered.
- Hands-On Practice: Apply your knowledge with exercises using more than 15 different datasets.
Course Highlights
-
The Why’s and What’s of Statistics: Grasp the importance of statistics in data science, understand the difference between populations and samples, and learn various sampling techniques. 📈
-
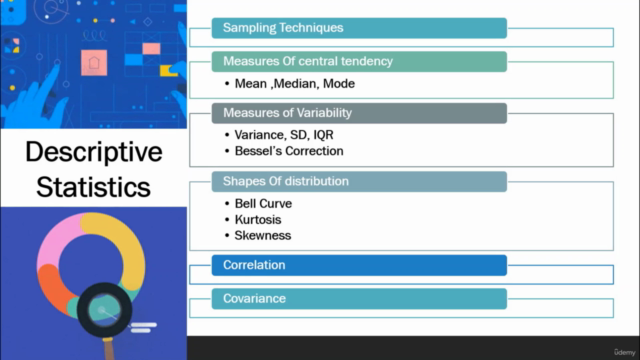
Descriptive Statistics: Dive into measures of central tendency (Mean, Median, Mode) and variability (Variance, SD, IQR, Bessel’s Correction), and get to grips with the shapes of distributions (Bell Curve, Kurtosis, Skewness). 📊
-
Variables & Interactions: Explore different types of variables, their interactions, and learn about correlation, covariance, collinearity, multicollinearity, feature creation, and selection. 🔀
-
Inferential Statistics: Get to grips with estimation techniques, the properties of the Normal Curve, the Central Limit Theorem, Z Scores, and Confidence Intervals. 🎯
-
Hypothesis Testing: Understand how to formulate null and alternative hypotheses, and learn various hypothesis tests including Z-tests, T-tests (one sample, independent, paired), Chi-Square tests (Goodness Of Fit, Independence), and ANOVA. 🧬
-
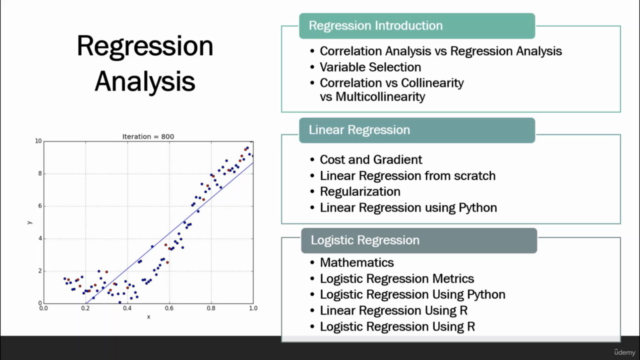
Regression Analysis: Learn the end-to-end process of variable creation, selection, data transformation, model building, and evaluation for both Linear and Logistic Regression. 📐
-
Statistical Methods Explained: Receive an in-depth explanation of statistical methods with real-life tips and tricks to give you an edge. 🏗️
-
Simple Language: All explanations are provided in simple language for ease of understanding and application in the future. 📖
-
Hands-On Practice: Work on more than 15 different datasets to get a quick start and learning advantage. 🧮
-
Real-Life Case Studies: Learn with case studies that bring concepts to life and provide context for their practical application in data science and business analysis. 🌐
Why You Should Take This Course 🎓
This course is your gateway to mastering the art of statistics within the realm of data science and analytics. By leveraging Python & R, two of the most powerful programming languages in this field, you'll gain hands-on experience that will set you apart from your peers. With expert instruction and a curriculum designed to build your confidence and competence, you'll be ready to tackle real-world problems with statistical precision. 🏆
Enroll now and transform your data science career from the ground up! 🚀💡
Course Gallery


Loading charts...