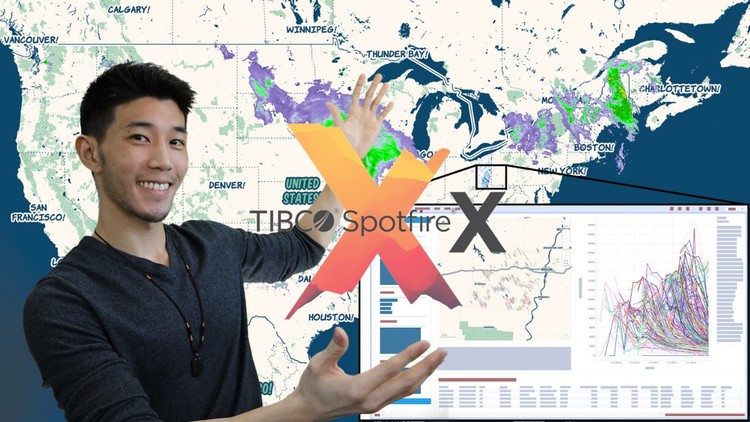
A Practical Guide to TIBCO Spotfire for Business Analytics

Why take this course?
🌟 Course Headline: A Practical Guide to TIBCO Spotfire for Business Analytics: Master Data Visualizations & Analysis 🚀
📘 Course Description:
Dive into the world of data analytics with our comprehensive online course, "A Practical Guide to TIBCO Spotfire for Business Analyticsc". This course is designed for professionals who aspire to transform raw data into compelling visual stories that can drive business decisions and strategic insights. With Jeff Locourse as your expert guide, you'll navigate through the robust features of Spotfire, a leading analytics platform, and learn how to create interactive dashboards that bring clarity to complex datasets.
Why Spotfire? 🔍
Spotfire stands out among data analytics platforms for its seamless blend of usability and advanced analytical capabilities. It's an ideal tool for data management, data wrangling, and powerful visualizations that can handle the demands of business analytics. Whether you're a beginner or looking to refine your skills, this course will empower you with the knowledge and techniques needed to extract meaningful patterns from your data.
Course Highlights:
-
Introduction to Spotfire: Get familiar with the platform's interface and its potential for transforming data into actionable insights.
-
Understanding Data Tables & Relationships: Learn how to manage data tables effectively, explore complex relationships within your data, and ensure the integrity of your analysis.
-
Mastering Data Visualizations: Discover a variety of visualization options in Spotfire, understand how they can be tailored to different analytical scenarios, and learn best practices for creating impactful charts.
-
Configuring Interactive Dashboards: Take your dashboards to the next level by configuring interactive elements that make your data accessible and insightful for decision-makers.
Course Structure:
-
Data Table Management & Relationships:
- Understanding data structures
- Establishing relationships between different data sources
- Data cleaning and preparation techniques
-
Data Visualizations for Analytics:
- Choosing the right visualization for your data story
- Techniques for creating clear and effective charts, graphs, and maps
- Tips on how to highlight key insights within your visualizations
-
Interactive Dashboard Configurations:
- Designing intuitive user interfaces
- Implementing filters, drill-downs, and other interactive elements
- Best practices for maintaining dashboard performance
Real-World Application:
Throughout the course, you'll work with a practical dataset from the Public Oil & Gas sector. This will not only illustrate real-world applications but also provide hands-on experience that is invaluable for your professional growth. You'll complete meaningful exercises and receive walkthrough solutions to solidify your learning.
Course Outcome:
By completing this course, you'll be equipped with the skills to design a fully functional Spotfire dashboard for data visualization, analysis, and business analytics. You'll have mastered the fundamentals of Spotfire and be ready to turn your own DATA into INSIGHT! 📊✨
Get Started Today! 🚀
Embark on a journey to becoming a data analytics expert with our "A Practical Guide to TIBCO Spotfire for Business Analytics" course. Join us and unlock the full potential of your data analysis capabilities.
Enroll now and transform your approach to business analytics with Spotfire! 🚀💻
Course Gallery


Loading charts...