PowerBI Tutorial : Mastering Data Visualization and Analysis

Why take this course?
🎉 PowerBI Tutorial: Mastering Data Visualization and Analysis 📊
Course Instructor: Arthur Fong
Course Title: PowerBI Tutorial: Mastering Data Visualization and Analysis
Unlock the Full Potential of Your Data with Power BI!
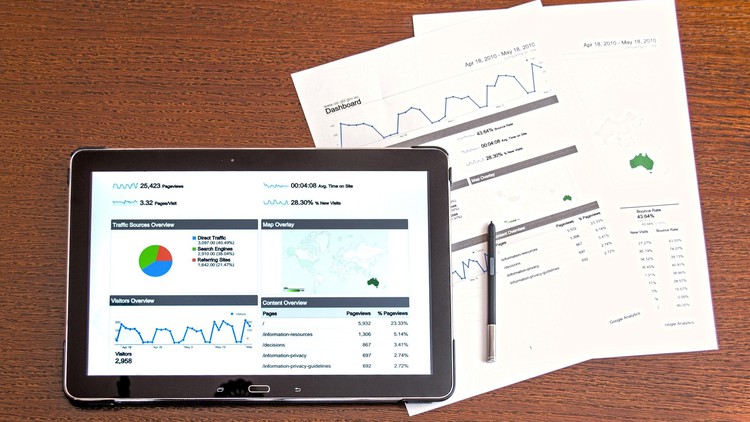
Introduction: In our data-driven world, the ability to analyze and visualize information is crucial for making informed decisions. Whether you're a business analyst, a marketing specialist, or an executive looking to drive strategic growth, understanding how to leverage data can give you the edge you need. Power BI by Microsoft is a comprehensive business analytics tool that enables anyone to visualize their data and share insights across their organization or embed them in an app or website.
Why Learn Power BI?
- Data Everywhere: Today, we are all surrounded by data – from structured databases to unstructured text fields on social media. Learning how to harness this data can transform the way you work.
- Business Intelligence (BI): Organizations across the globe are using BI tools to make informed decisions that drive business growth, prevent losses, and improve marketing strategies.
- Decision Making: Data is only valuable when it's turned into insights. Mastering Power BI allows you to make data-driven decisions confidently.
What You Will Learn:
- From Scratch: This course starts from the very basics, so no prior knowledge of Power BI or data analysis is required.
- Data Visualization: Learn how to create compelling visualizations that turn complex data sets into clear, actionable stories.
- Data Analysis Techniques: Discover advanced analysis techniques to drill down into your data and uncover hidden trends.
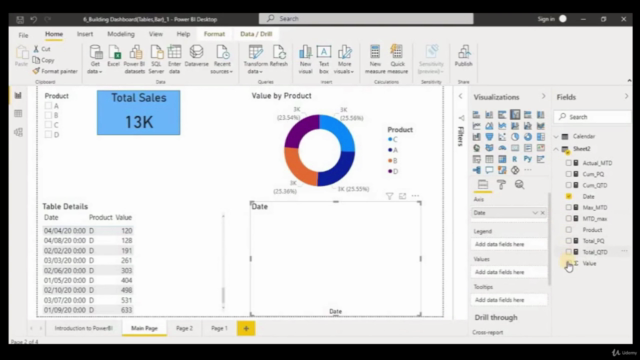
- Interactive Dashboards: Build interactive dashboards that let you and others explore the data in real-time.
- Data Modeling: Understand how to structure your data for more efficient analysis with data modeling.
- Automation & Reporting: Learn how to automate reporting tasks and reduce manual work.
Course Highlights:
- Step-by-Step Guidance: Arthur Fong, an expert in Power BI, will guide you through each concept with clarity and practical examples.
- Hands-On Experience: You'll get hands-on practice with real-world datasets to solidify your learning.
- Practical Application: Apply what you learn directly to your own data and projects.
- Community Support: Join a community of like-minded learners who are on the same journey as you.
Course Structure:
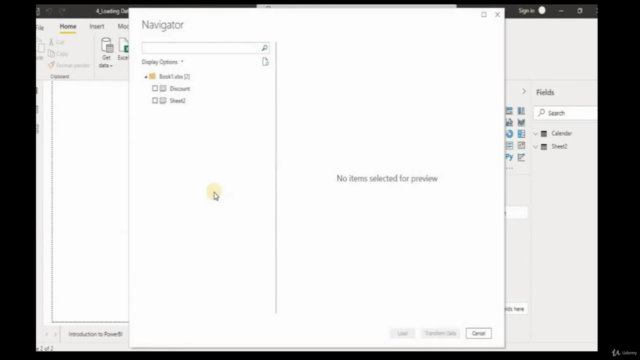
- Getting Started with Power BI: Understanding the interface, importing data, and creating your first report.
- Data Shaping and Transformation: Cleaning and preparing your data for analysis with Power Query.
- Advanced Data Visualization: Creating advanced visuals and charts to tell a story with your data.
- Interactive Dashboards: Building interactive dashboards that allow users to explore the data on their own.
- Data Modeling Techniques: Setting up efficient data models for complex data analysis.
- Automation & Report Distribution: Automating reports and distributing them effectively across your organization or client base.
- Capstone Project: Applying all you've learned to a real-world dataset, culminating in a presentation of your findings.
Who Is This Course For?
- Aspiring data analysts and business intelligence professionals.
- Managers and executives who want to make data-driven decisions.
- Marketing specialists aiming to understand market trends and campaign performance.
- Anyone interested in learning how to turn raw data into actionable insights with Power BI.
Conclusion: Embark on a journey to master data visualization and analysis with Power BI. Whether you're an aspiring analyst or a seasoned professional, this course will equip you with the skills needed to make data work for you. Enroll now and transform your organization with the power of data! 🚀
Course Gallery


Loading charts...