Power BI Visual Calculations

Why take this course?
🌟 Course Headline: Unlock the Full Potential of Your Data with Power BI Visual Calculations!
Course Description:
Embark on a transformative learning journey with our comprehensive online course, "Power BI Visual Calculations," led by the renowned Randy Mindercourse. This course is a game-changer for anyone passionate about data visualization and analytics. 📊💡
What You'll Discover in This Course:
Why Visual Calculations?
In the world of Power BI, visual calculations are a breath of fresh air for those who have found traditional DAX (Data Analysis Expressions) daunting or restrictive. This innovative feature allows you to perform complex calculations directly on your Power BI visuals without the need for creating measures or invoking CALCULATE. It's like having a versatile Swiss Army knife for your data analysis needs! 🛠️✨
Why This Course?
- Simplified Learning: We'll simplify the complexities of DAX, making it more approachable for beginners and providing advanced users with new ways to visualize their data.
- Visual Approach: With visual calculations, you can directly apply your custom calculations on charts, tables, and other Power BI visuals, reducing the need for intricate models or complex DAX formulas.
- Efficiency and Ease: Achieve more with less effort. Create powerful visuals that reflect precise and insightful data analysis at a glance.
Course Highlights:
- DAX Demystified: We'll explore why DAX can be challenging to master and how visual calculations offer a more intuitive approach.
- Design Philosophy: Understand the design principles behind Power BI's visual calculations and the vision of the development team.
- Hands-On Learning: Learn step-by-step how to integrate visual calculations into your reports, from calculating profit margins to computing moving averages—all directly in your visuals!
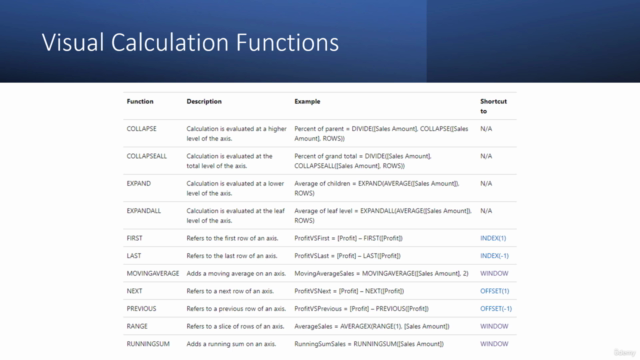
- Template Functions Explained: Dive deep into the powerful template functions and their parameters that enable dynamic and flexible visual calculations.
- New DAX Functions Introduced: Get up to speed with the latest DAX functions introduced alongside visual calculations, and see how they can enhance your analysis capabilities.
- Interactive Quizzes and Exercises: Test your knowledge with quizzes and apply what you've learned with practical exercises.
By Course Completion, You Will Be Able To:
- Effortlessly create complex calculations within your Power BI visuals without relying on traditional DAX measures or CALCULATE functions.
- Simplify your reports and reduce the complexity of your data model.
- Unlock powerful insights that were previously out of reach due to DAX limitations.
- Impress your clients, stakeholders, or team members with insightful, accurate, and easy-to-understand Power BI dashboards.
Join Randy Mindercourse in Mastering Power BI Visual Calculations Today! 🚀📈
Embark on a transformative learning journey with our comprehensive online course, "Power BI Visual Calculations," led by the renowned Randy Mindercourse. This course is a game-changer for anyone passionate about data visualization and analytics. 🌟✨
Take your first step towards becoming a Power BI pro and start creating powerful visuals without the complexity of traditional DAX formulas. Enroll in this course now and begin your journey to mastering Power BI Visual Calculations! 🚀📚
Course Gallery


Loading charts...