Power BI Certified Data Analyst Training

Why take this course?
🚀 Welcome to Your Journey into Data Mastery with Power BI! 🚀
Are you ready to transform raw data into insightful stories that can propel your business to new heights? 📈 With our comprehensive Power BI Tutorial for Beginners, you'll dive into the world of business intelligence (BI) and emerge as a data analysis pro!
Course Overview:
🎓 What You'll Learn:
- The essentials of Power BI, from data extraction to actionable insights.
- How Data Analysts play a pivotal role in harnessing the power of data within an organization.
- The art of preparing and modeling your data for analysis.
- Techniques to bring your data to life with powerful visualizations and reports.
- The ability to connect, integrate, and work with various data sources.
- How to leverage AI-driven analytics to uncover deeper insights.
- Creating custom visualizations with R and Python.
- Keeping your reports current with seamless data refresh functionality.
- Accessing your dashboards on-the-go with the Power BI mobile app.
- Collaborating effectively with colleagues in real time.
- Ensuring your data is secure with robust compliance features.
Course Structure:
Lesson 1: Power BI – Overview & Setup
- Introduction to Power BI and its key features.
- Understanding the differences between Power BI, Pro, and Premium plans.
- Step-by-step guide on installing Power BI on Windows 11.
Lesson 2: Power BI – Get Data
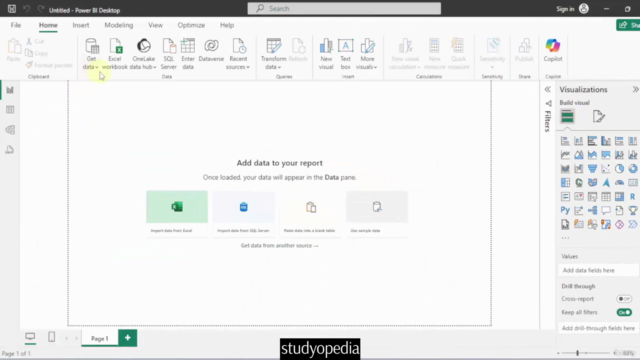
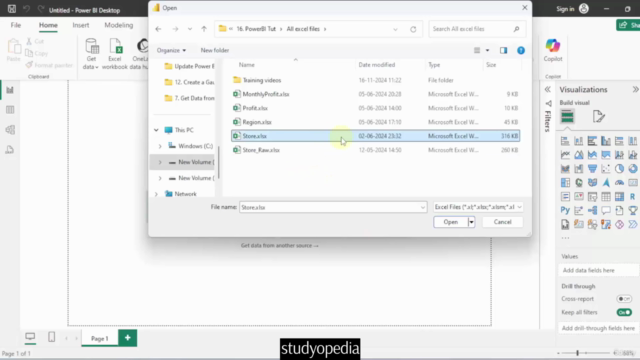
- Techniques for importing data from Excel spreadsheets.
- Exploring other methods to bring in data from diverse sources.
Lesson 3: Power BI – Visualizations
- Creating compelling visualizations like Gauge Charts and Column Charts.
- Learning the best practices for formatting and updating visual elements.
Lesson 4: Power BI – Cards
- Crafting engaging performance cards.
- Mastering card formatting for greater impact.
Lesson 5: Power BI – Tables
- Building comprehensive tables.
- Applying conditional formatting to highlight crucial information.
Lesson 6: Power BI – Filters and Slicers
- Implementing filters to refine your data view.
- Utilizing slicers for an interactive way to explore data dimensions.
Lesson 7: Power BI – Data Transformation
- Understanding the importance of data transformation for analysis.
- Mastering techniques like grouping rows, pivoting columns, and adding custom columns.
Lesson 8: Power BI – Reports and Dashboards
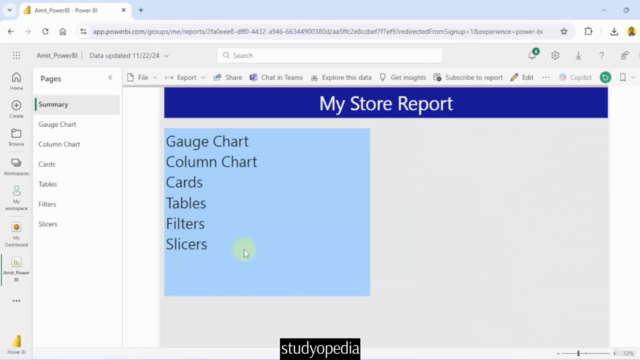
- Crafting powerful reports and publishing them in the Power BI Service Account.
- Designing dashboards that offer a strategic overview from your report data.
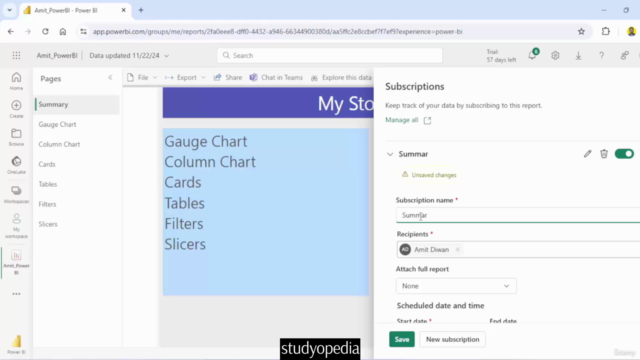
- Exploring subscription options for keeping up with your reporting needs.
Embark on Your Data Analysis Adventure Today! 🌟
By the end of this course, you'll not only understand how to use Power BI to its fullest potential but also how to extract meaningful insights that can guide decision-making and drive business success. 📊💼
So, are you ready to transform your data into a narrative? Let's get started! 🏗️➡️📊🚀
Course Gallery


Loading charts...