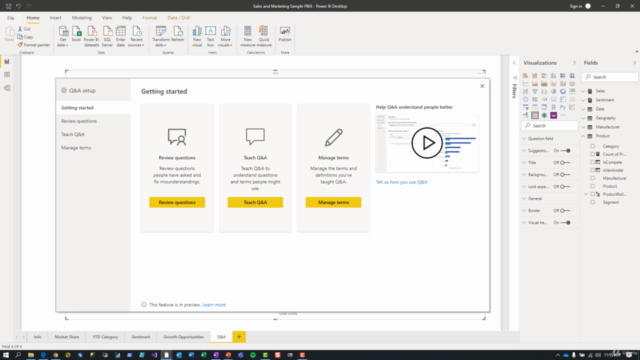
Power BI Q&A Visual

Why take this course?
🌟 Course Headline:
Unlock the Full Potential of Your Data with Power BI Q&A Visual!
🚀 Course Description:
Dive into the dynamic world of data analysis with our comprehensive online course, led by the esteemed Randy Mindercourse. Discover the transformative power of Power BI's Q&A Visual, a cutting-edge feature that merges natural language processing with the robust capabilities of Power BI. This isn't just another tool; it's your gateway to seamless data discovery and insightful reporting!
What You'll Learn:
-
Introduction to Q&A Visual: Understand the fundamental concepts behind this AI-driven feature and its significance in modern data analytics.
- How it works
- Its impact on user engagement and self-service BI
-
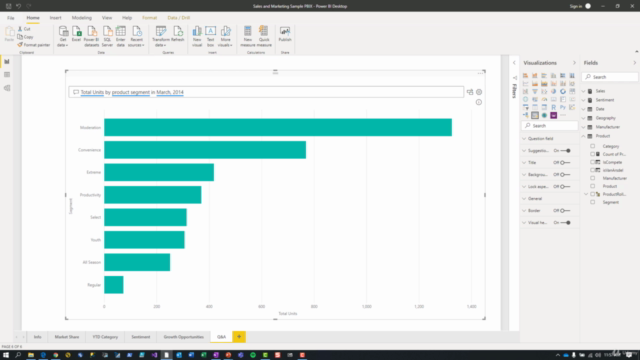
Mastering Q&A Visual Interaction: Learn the ins and outs of using natural language to interact with your reports, making complex analyses simple and intuitive.
- Best practices for crafting queries
- Tips for achieving accurate results
- Exploring different query types (e.g., summaries, trends, comparisons)
-
Designing with Q&A Visual: Tap into the creative potential of Power BI's Q&A to design reports that speak directly to your users' needs.
- Incorporating Q&A visuals into your reports effectively
- Utilizing the visual for interactive storytelling
-
Advanced Q&A Visual Techniques: Take your skills to the next level by understanding how to leverage the Q&A visual alongside other Power BI features.
- Combining Q&A with cross-filtering/cross-highlighting for comprehensive analysis
- Implementing bookmarks for a more dynamic and interactive experience
-
Real-World Applications: See firsthand how the Q&A Visual can be applied in various business scenarios, enhancing decision-making and data literacy across your organization.
- Case studies of successful Q&A implementations
- Best practices for deploying Q&A visuals in different organizational contexts
Why This Course?
- Hands-On Learning: Engage with real-world scenarios that challenge you to apply what you learn.
- Expert Guidance: Learn from Randy Mindercourse, a seasoned professional with a wealth of knowledge and experience in Power BI.
- Interactive Content: Access to interactive labs and quizzes to reinforce your understanding.
- Community Support: Join a community of like-minded learners to share insights and experiences.
- Future-Ready Skills: Equip yourself with the skills to stay ahead in the rapidly evolving field of data analytics.
By the end of this course, you'll be empowered to transform your approach to data analysis, making you an indispensable asset to any team. Don't miss out on the opportunity to redefine how you interact with data – enroll in Power BI Q&A Visual today! 🎓✨
Enrollment is Now Open! Click "Sign Up" to secure your spot and begin your journey towards mastering Power BI's Q&A Visual. Elevate your data analysis skills and unlock the full potential of your data with AI-driven efficiency and effectiveness. Let's get started! 🚀💫
Course Gallery


Loading charts...