Power BI & Power Pivot: Introduction

Why take this course?
🌟 Power BI & Power Pivot: Introduction 🌟
Crash course on how to work effectively with Power BI and Power Pivot
Are you ready to transform raw data into captivating visual stories? Dive into the world of business intelligence with our comprehensive introduction to Power BI & Power Pivot. This course is your fast-track to mastering these powerful tools for data analysis, visualization, and management.
Why Power BI & Power Pivot?
-
Power Pivot: Elevate your Excel skills to the next level with Power Pivot, Microsoft's add-in that allows you to create robust data models and handle large amounts of data without compromising on performance.
-
Power BI: Bring your data to life! With Power BI, you can create interactive reports and dashboards that provide actionable insights through compelling visualizations.
Course Highlights:
🔹 From a normal pivot table to Power Pivot:
- Working with tables
- Combining data the old way
- Creating relationships in Power Pivot
- Connecting a pivot table to the data model (✨ NEW ✨)
🔹 Building a data model in Power Pivot:
- Importing data into Power Pivot
- Data modeling and relationships
- Creating a pivot table connected to a data model
🔹 Creating a dashboard using Power Pivot:
- Importing data
- Data modeling
- Report structure
- Report filters
🔹 Building a report in Power BI:
- Introduction to Power BI (🚀 Get started with the basics!)
- Loading data into Power BI
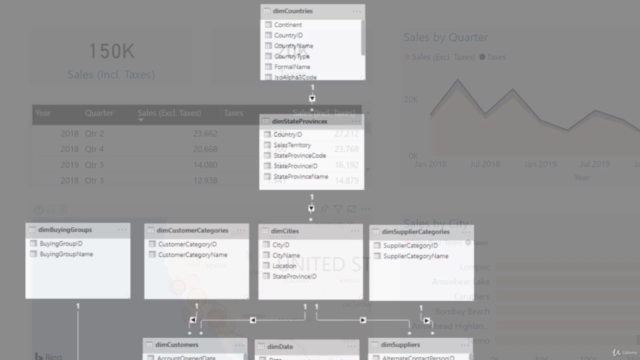
- Creating relationships
- Creating a date table
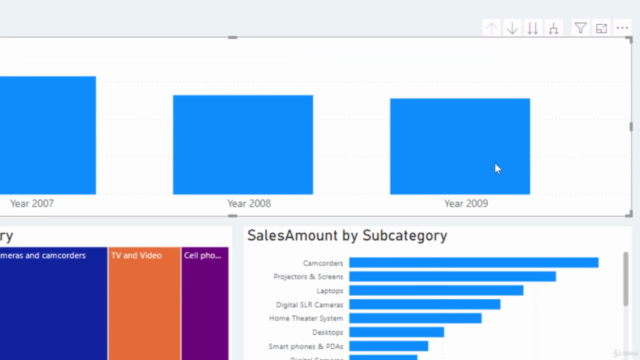
- Visualizations- Area charts, Bar charts, Maps, Cards (📊 Bring your data to life!)
What You'll Learn:
- Data Importing: Learn how to efficiently import data into both Power Pivot and Power BI.
- Data Modeling: Discover the art of building robust data models that can handle complex business scenarios.
- Creating Relationships: Master the process of creating strong relationships between different datasets, ensuring accurate analysis.
- Advanced Visualizations: Go beyond basic charts and learn to create compelling maps, cards, and more to present your data in a meaningful way.
- Building Dashboards & Reports: From conceptualizing to executing, you'll learn the best practices for creating dashboards and reports that drive decision-making.
Who is this course for?
Whether you are an analyst, business professional, data enthusiast, or someone looking to enhance your skills in data analysis and visualization, this course is tailored to all levels of expertise. No prior experience with Power BI or Power Pivot is required – just a willingness to learn and transform data into actionable insights.
Join us on this exciting journey to unlock the power of your data! With hands-on exercises and real-world applications, you'll be creating compelling dashboards and reports in no time. 🚀
Enroll now and take your first step towards becoming a data analysis expert with Power BI & Power Pivot! 📊✨
Course Gallery


Loading charts...