Power BI: Nice Tips || Real Time Scenario

Why take this course?
🌟 Power BI: Nice Tips || Real Time Scenarios with Sachin Agrawal 🌟 Course Headline: Power BI: Nice Tips || Real Time Scenarios
Unlock the Full Potential of Power BI!
Course Description:
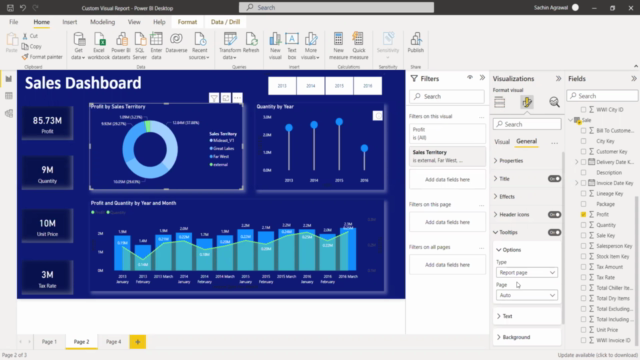
Dive into the world of data visualization and reporting with our comprehensive course, Power BI: Nice Tips || Real Time Scenarios. Taught by the expert, Sachin Agrawal, this course is designed to take your Power BI skills to the next level. You'll discover hidden features and learn to create a stunning dashboard that will enhance your reporting capabilities.
What You'll Learn:
-
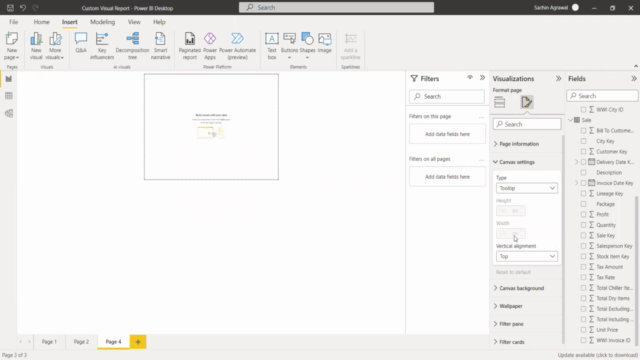
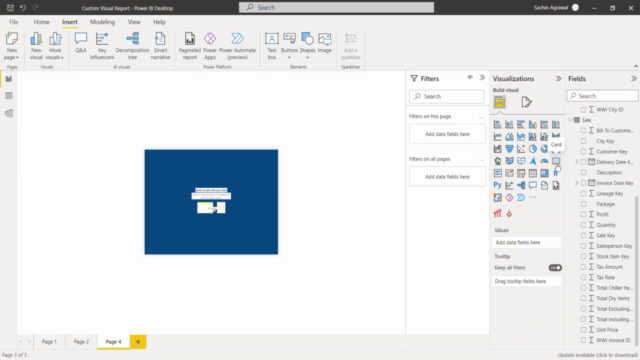
Mastering Custom Tooltips: Learn how to enrich your reports with custom tooltips, providing users with relevant information right at their fingertips.
-
Drill Down Functionality: Understand the power of drill down capabilities, allowing users to navigate through different levels of data granularity effortlessly.
-
Bookmark Wizardry: Gain control over your reports by mastering the art of bookmarks, including toggling, slicer panels, and more, to streamline navigation and storytelling.
-
Drill Through Insights: Explore the drill through feature for an in-depth analysis of data without losing the context or leaving your dashboard.
-
Smart Narrative and Sorting: Craft compelling narratives with Smart Narrative, and learn to sort data intelligently to present information in a logical and user-friendly manner.
-
Q&A Feature and Decomposition Tree: Discover the Q&A feature for quick insights, and use decomposition trees to break down data into its components for deeper analysis.
-
Visual Alignment & Gradient Colors: Perfect your dashboard aesthetics with visual alignment options and gradient colors that make your report visually appealing and easier to interpret.
-
Navigation and Object Management: Streamline user experience by mastering page navigation, easy page movement, object movement, and locking options to maintain the integrity of your dashboards.
Real Time Scenarios:
-
Handling Blank Values: Learn how to convert blank values to zero to ensure no data is left untreated in your analysis.
-
Conditional Formatting with Images: Enhance your reports with conditional formatting, and use images to add a visual flair that conveys your message more effectively.
-
Dynamic Changes and Conditional Logic: Implement default state drill through, dynamic column selection, and dynamic text changes for real-time, responsive dashboards.
-
Dynamic Title Changes: Keep your reports fresh and relevant by dynamically updating titles based on your data.
-
Calendar Sequences and RLS: Calculate sequential months, add running totals, and create dynamic RLS rules with userprincipalnames for more precise analysis.
-
Year Vs Period Analysis: Understand the differences between current year (CY) and previous year (PY) analysis, and perform a running total calculation to track trends over time.
Why Take This Course?
Power BI is an incredibly powerful tool for data analysts and business professionals looking to transform raw data into meaningful insights. This course will equip you with the skills to not only visualize data effectively but also to create dynamic, real-time dashboards that provide critical insights at a glance.
Whether you're an experienced user looking to refine your expertise or new to Power BI, this course will help you unlock the full potential of this robust platform. Join Sachin Agrawal as he guides you through each feature, tip, and real-time scenario with practical examples and expert advice.
Keep Learning & Exploring New Things! 🚀
Enroll now to begin your journey into advanced Power BI analytics and take your data storytelling to the next level! 📊✨
Course Gallery


Loading charts...