Power BI Master Class - Dashboards and Power BI Service

Why take this course?
🚀 Power BI Master Class - Dashboards and Power BI Service 📊
Unlock the Secrets of Data with Ian Littlejohn! 🧠
Course Headline: 🎯 Master Data Analysis & Interactive Dashboards with Power BI
Welcome to Your Power BI Journey! 🎉
If you're new to Power BI or looking to refine your skills, THIS IS THE COURSE FOR YOU. We've distilled the essentials so you can grasp the fundamentals of Power BI effectively. No need to endure tedious, drawn-out training sessions! With this course, you'll get up to speed in half the time and lay down a solid foundation for your path to becoming a Power BI expert.
What Students Are Saying: 🗣️
- "A lot of detailed information! I learned a lot and would highly recommend this course to anyone at a beginner or intermediate level." ⭐
- "The course is very detailed, concise, and at the right pace. I'd recommend this course to everyone starting with PBI." ⭐
- "After completing this course, I got to know how much power Power BI holds, especially for creating interactive dashboards and critical reports." ⭐
- Lifetime access to course materials and practice activities included! 🎓
About the Trainer: 👨🏫
This course is led by Ian Littlejohn, an international trainer, consultant, and data analyst with over 250,000 enrollments and 150,000 students on Udemy. Ian's expertise lies in teaching data analysis techniques, Excel Pivot Tables, Power Pivot, Microsoft Power BI, Google Data Studio, Amazon Quicksight, and his courses boast an average rating of over 4.5 stars out of 5.
Course Overview: 🌟
Skills in data analysis, reporting, and dashboard creation are indispensable in today's competitive business landscape. Microsoft Power BI stands as the world's leading Business Intelligence tool for developing reports, conducting data analysis, and building interactive dashboards.
In this course, you will:
- Get Introduced to the course content and what you can expect to learn.
- Sign Up for Power BI and load your first dataset.
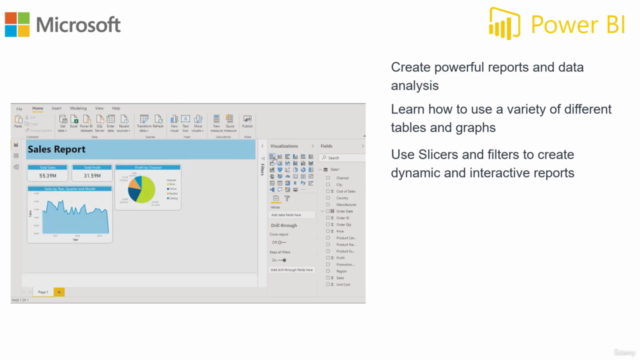
- Explore various visualization types like Tables, Cards, Matrix, Multi Row Cards, and more.
- Learn how to use Filters and Slicers to interact with your data.
- Perform trend analysis and gain insights from your data.
- Create engaging Interactive Reports and Dashboards.
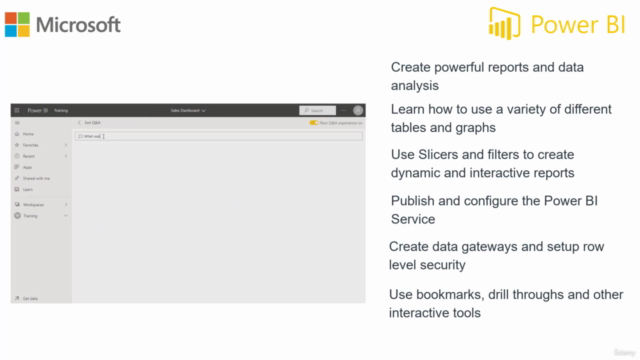
- Publish your work to the Power BI Service and configure it for the best performance.
- Understand Security measures and set up Workspaces.
- Configure Data Gateways for data refresh needs.
- Utilize drill-throughs, bookmarks, advanced tooltips, and grouping to enhance user experience.
- Work with Custom visualizations and themes to make your dashboards pop.
- Integrate Power BI with Microsoft Excel for an enriched data analysis experience.
- Learn how to publish and embed dashboards and reports.
Course Series: 📖
This course is part of a series designed to take you from the basics to the advanced functionalities of Power BI. The full series includes:
- Query Editor - Mastering data transformation and shaping.
- Data Modeling & DAX Formulas - Crafting efficient and effective data models.
- Dashboards & Power BI Service - Designing, publishing, and embedding your dashboards for the world to see.
Embark on a journey to become a Power BI whiz with Ian Littlejohn's comprehensive Master Class series. Whether you're starting from scratch or looking to deepen your existing knowledge, this course will equip you with the skills needed to turn data into actionable insights and beautiful visualizations. 📈
Remember, the power of data awaits. Let's unlock it together! 🗝️
Course Gallery


Loading charts...
Comidoc Review
Our Verdict
This Power BI Master Class with its 5.5 total hours of instruction provides an excellent introduction to the world of Business Intelligence tools. With 4.58 out of 5 global rating, over 37000 subscribers and an update as recent as September 2024, it certainly shows its popularity and relevance among users. The course excels at teaching you core features for creating impactful data visualizations through interactive dashboards and diving into Power BI Service configuration. While some aspects like industry-specific examples and advanced topics such as Data queries can be expanded further, the course serves beginner-to-intermediate audiences quite well in their quest to master Power BI's data analysis capabilities.
What We Liked
- Comprehensive coverage of Power BI's data analysis and dashboard creation features, helping build confidence in using the Business Intelligence tool
- Highly interactive learning experience, with downloadable datasets and custom visualizations for hands-on practice
- Expert instructor providing clear, concise, and engaging lessons, making complex topics easily understandable
- In-depth exploration of various graph visualizations and report creation using FILTERS and SLICERS to ask meaningful questions of the data
Potential Drawbacks
- Limited focus on specific industries during practice activities; broader examples could have showcased greater versatility
- Small number of lessons dedicated to working with Power BI and Excel together, which could be expanded for better integration experience
- Occasional technical issues when accessing the course might affect some learners' progress but were usually resolved quickly
- Advanced features like Data queries, Data modelling, or DAX formulas are not discussed in-depth as course focus is primarily on data visualization