Power BI in less than 1 hour

Why take this course?
Course Title: Power BI in less than 1 Hour - A Power BI Crash Course
Course Headline: Master the Art of Data Visualisation with Power BI in Record Time! 🏁🚀
Dive into the World of Business Analytics with Power BI! 📊✨
Want to transform raw data into compelling insights? Look no further! In just 60 minutes, our "Power BI in less than 1 Hour" course will equip you with the essential skills to harness the power of business analytics and intelligence using Power BI.
What You'll Learn:
- Set Up & Configuration: Get up and running with Power BI - we'll guide you through every step.
- Data Importing: Learn how to import data seamlessly into your Power BI dashboard.
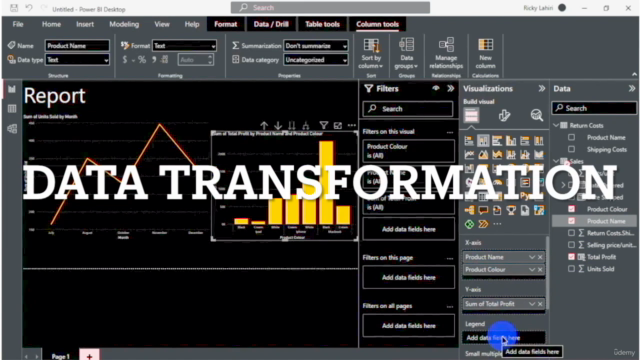
- Data Transformation: Master the art of cleaning, merging, and transforming datasets to create clear and actionable visualizations.
- Pivot Tables & Pivot Plots: Discover the power of pivoting data to unveil hidden patterns and trends.
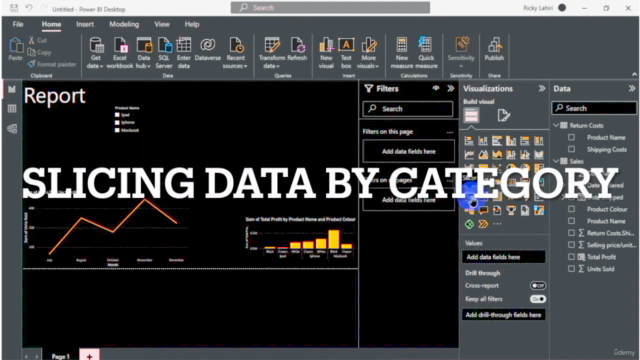
- Slicers & Filters: Slice through your data with ease using slicers, and filter out the noise to focus on what matters.
- Custom Visualizations: Go beyond basics and learn how to use calculated fields for advanced analysis.
- Publishing Reports: Share your insights by publishing reports for stakeholders and teams.
Why Power BI?
Power BI is a state-of-the-art analytics tool from Microsoft that allows anyone to visualize data with greater impact. It's a powerful tool used by data analysts, business intelligence professionals, and decision-makers across industries. By mastering Power BI, you open doors to career opportunities in Business Analytics and Business Intelligence.
Course Outline:
✅ Installing Power BI - Get started with the software that will transform your data into stories. ✅ Importing Data - Learn how to bring data from various sources into Power BI effortlessly. ✅ Data Merging & Transformation - Combine and shape data to make it ready for analysis. ✅ Calculated Fields - Enhance your reports with custom calculations. ✅ Pivot Tables & Pivot Plots - Turn complex datasets into simple, powerful visualizations. ✅ Slicers - Interactively filter and segment data to reveal different perspectives. ✅ Publishing Reports - Share your findings with a broader audience within or outside your organization.
By the end of this course, you'll be able to:
- Visualize and interpret large datasets using charts, tables, slicers, pivot charts, and pivot tables in Power BI.
- Create dynamic and interactive reports that can help inform critical business decisions.
- Impress employers with your newfound skill set, making you an attractive candidate for Business Analytics and Business Intelligence roles.
Don't miss out on this opportunity to become a data visualization hero! Enroll in "Power BI in less than 1 Hour" today and start your journey towards becoming a data guru. 🌟
Ready to unlock the secrets of Business Analytics with Power BI? Click here to enroll now and turn your data into insights!
Course Gallery


Loading charts...