Interactive python dashboards | Plotly Dash 2022| 3 Projects

Why take this course?
GroupLayout: "course-description"; Headline: "📊 Master Interactive Python Dashboards with Plotly Dash - 3 Real Projects in 2022!";
Welcome to the Course on Dash Plotly!
Embark on a journey to master the art of creating interactive and mobile-responsive dashboards using Plotly's Dash library. In this comprehensive course, you'll learn how to craft visualizations that not only display data but also engage users by allowing them to interact with the data in real-time.
Why Learn Plotly Dash? 🎯
- Data Visualization: Unlock your data's story with beautiful, interactive plots.
- Ease of Use: Say goodbye to HTML, CSS, and Javascript for frontend development; Plotly Dash simplifies the process.
- Mobile Responsiveness: Design dashboards that adapt to any screen size, enhancing user experience across devices.
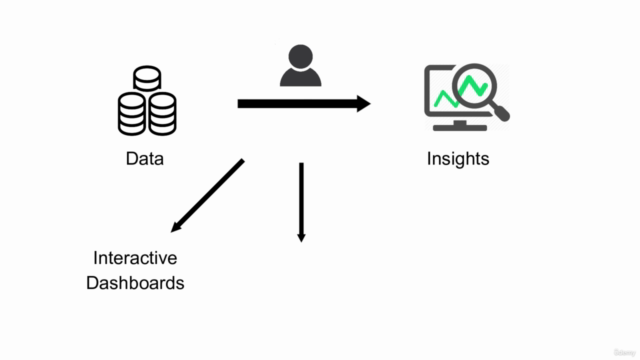
- Interactive Experience: Create dashboards that are more than static visualizations—enable users to explore data and discover insights.
Who is this for? 👤
Whether you're a Data Analyst eager to present your findings in an impactful way or a Data Scientist aiming to deploy user interfaces for your machine learning models, this course is designed for you.
Course Highlights:
- Hands-On Learning: Dive into practical examples and real-world scenarios.
- Full Project Approach: Learn by doing with three complete projects:
- Project 1: An Interactive Covid-19 World Tracker
- Project 2: A Retail Sales Analysis Dashboard
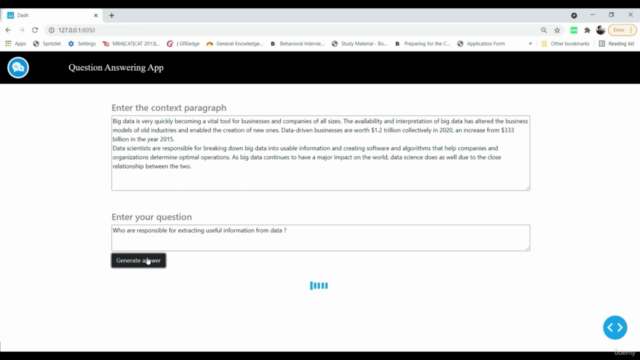
- Project 3: An NLP (Natural Language Processing) Sentiment Analysis Dashboard
- Step-by-Step Guidance: From the basics of Plotly Dash to advanced features and techniques.
- Responsive Design: Learn how to make dashboards that work seamlessly across devices.
- Final Project: Apply all your newly acquired skills to create a comprehensive interactive dashboard.
What's Inside:
- Introduction to Plotly Dash: Understand the core concepts and components of Dash.
- Data Manipulation with Pandas: Learn how to prepare and manipulate data for visualization.
- Creating Interactive Components: Explore various interactive elements you can include in your dashboards.
- Styling Your Dashboards: Customize the look and feel of your dashboards for a professional touch.
- Deploying Your Dashboards: Learn how to share your work with others, making your dashboards accessible on the web.
- Best Practices: Understand design principles that make for an effective dashboard.
- Final Projects: Combine all your skills to build and deploy three real-world interactive dashboards.
Your Instructor: 👩🏫
Anmol Tomar, with a passion for data visualization and teaching, is here to guide you through each concept, ensuring you have the confidence and skills to create your own interactive dashboards by the end of this course.
Join us on this exciting learning journey and transform the way you interact with data! 🚀
Preview Image: 🖼️ Designed by Freepik
Note: This course is designed for learners with a basic understanding of Python. No prior experience with HTML, CSS, or Javascript is required.
Course Gallery


Loading charts...