Build Interactive Plotly & Dash Dashboards with Data Science
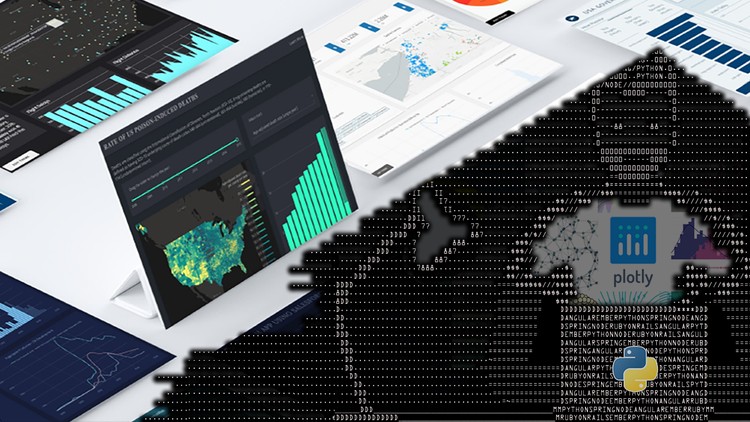
Why take this course?
📊 Course Title: Build Interactive Plotly & Dash Dashboards with Data Science
🚀 Course Headline: Learn how to build integrated interactive dashboards that focus on telling stories with data science.
🔥 Course Description:
Welcome to the ultimate journey into the world of data storytelling! In this course, you will embark on a dynamic learning experience that will transform you from a mere observer of data to an active narrator capable of creating captivating and interactive Plotly & Dash dashboards. This isn't just another static visualization course; it's a deep dive into the art of data interaction and real-time updating, where your dashboards will come alive with the data you feed them.
Why Take This Course?
- Advanced Skills: Build off the basics to master the advanced components of dashboard creation.
- Unique Content: Each lesson and dashboard is crafted as a new creation, ensuring a fresh learning experience.
- Real-Time Interactivity: Learn how to make dashboards update in real-time based on user inputs or external data sources.
- Storytelling with Data: Focus on the narrative aspect of your data, turning numbers into compelling stories for your audience.
- Professional Growth: Enhance your skills as a data scientist, analyst, or developer to stand out in the job market.
What You'll Learn:
✅ Fundamentals to Mastery: Develop a strong foundation and progressively learn advanced techniques in dashboard creation.
- Interactive Components: Discover how to create interactive elements within your dashboards, such as dropdowns, sliders, and buttons.
- Real-Time Data Handling: Learn to handle real-time data updates, keeping your dashboards current and relevant.
- Storytelling Techniques: Understand the principles of effective data storytelling to communicate complex ideas clearly and engagingly.
- Integration & Customization: Integrate various APIs and customize your dashboards for specific use cases.
Course Structure:
-
Introduction to Plotly & Dash: Get started with the basics of these powerful libraries for creating interactive visualizations.
-
Building Your First Interactive Dashboard: Create a basic dashboard and introduce interactivity into your visualizations.
-
Advanced Dash Components: Explore advanced components and learn how to use them effectively in your dashboards.
-
Data Storytelling Essentials: Learn the key elements of storytelling with data, including narrative structure, visual design, and best practices.
-
Real-Time Data Integration: Understand how to integrate real-time data sources into your dashboards for up-to-the-minute insights.
-
Customization & User Experience: Tailor the look and feel of your dashboards and enhance user experience with custom styling, layouts, and performance optimizations.
-
Capstone Project: Apply all you've learned to create a comprehensive dashboard that tells a compelling story with real-world data.
By the end of this course, you will not only be proficient in creating interactive Plotly & Dash dashboards but also adept at telling stories with your data that resonate with your audience. 🎨📈
Join Profesor Pip on this exciting journey and elevate your data science skills to new heights! Sign up now and become a master storyteller through the power of interactive dashboards. Let's turn data into dialogue and analysis into action! 🚀✨
Course Gallery
Loading charts...