PivotTables: From Slicers to Dashboards

Why take this course?
🎓 Course Title: PivotTables: From Slicers to Dashboards
🎥 Course Headline: Master Excel PivotTables and Create Dynamic Dashboards with Confidence!
Unlock the Full Potential of Your Data with Excel PivotTables!
Are you ready to transform the way you handle data in Excel? Our comprehensive course, led by the expert Linda Hoskinsc, will guide you through the intricacies of PivotTables, from creating your first PivotTable to developing sophisticated dashboards. 📊✨
Why Take This Course?
- Comprehensive Understanding: Learn everything from the basics to advanced techniques in Excel PivotTables.
- Interactive Learning: Discover how to filter and sort data using Slicers and Timelines, making your analysis dynamic and responsive.
- Visualize Your Data: Turn your PivotTables into captivating PivotCharts for better data storytelling.
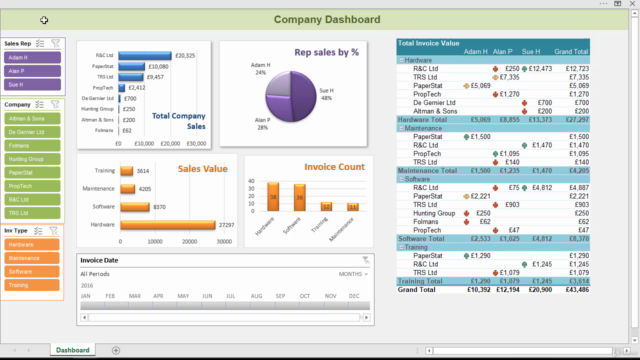
- Create Dashboards: Learn to compile all your key data points into a single, interactive dashboard for at-a-glance insights.
- Hands-On Practice: Each lesson comes with an Excel file for demonstration and an accompanying exercise to practice your new skills. 🖥️📚
- Easy Access to Demo Files: For Lesson 1, we've provided a zip file to download all course demo files in one place – saving you time and hassle!
Course Breakdown:
-
Introduction to PivotTables: Get familiar with the basic concepts and how PivotTables can simplify your data analysis.
-
Creating Your First PivotTable: Learn step-by-step how to set up a PivotTable from scratch.
-
PivotTable Functions & Features: Explore advanced functions, custom sorting, and grouping within PivotTables.
-
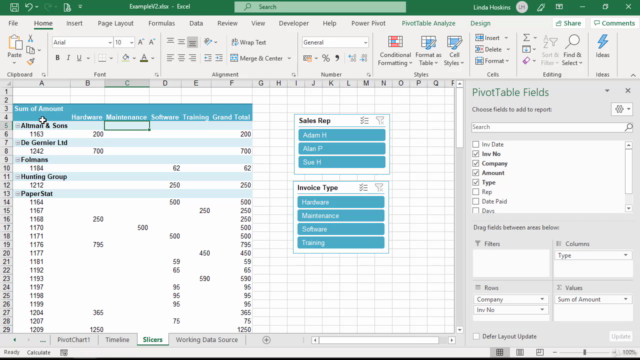
Using Slicers for Interactive Filtering: Discover how to add interactive slicers to your PivotTable for easy data filtering.
-
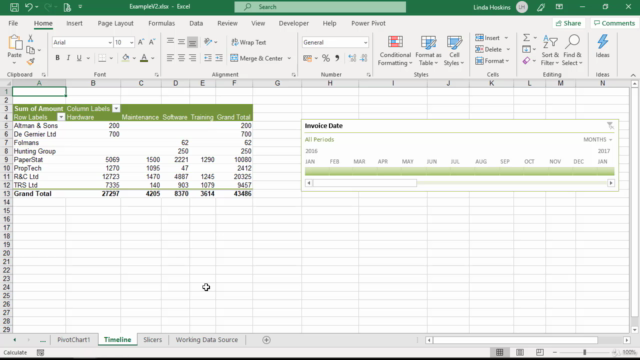
Timelines for Data Segmentation: Learn to use Timelines to visualize and compare data over different time periods.
-
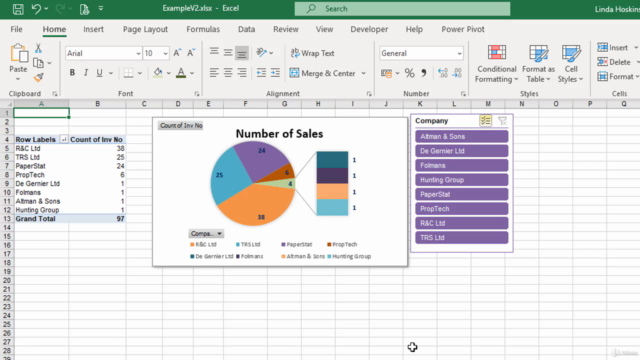
From PivotTables to PivotCharts: Turn your data into engaging visuals with PivotChart functionality.
-
Building Your First Dashboard: Combine everything you've learned to create a comprehensive dashboard for real-time data analysis.
-
Advanced Dashboard Techniques: Elevate your dashboards with conditional formatting, data bars, and sparklines.
-
Final Project: Apply all the skills you've acquired in this course to a final project – a fully functional dashboard of your own design.
Who Is This Course For?
This course is ideal for:
- Business professionals who want to streamline their data analysis process.
- Data analysts looking to enhance their skill set with Excel PivotTables.
- Finance managers seeking to improve financial reporting and forecasting.
- Anyone interested in learning advanced Excel features for personal or professional use.
Course Materials:
- Lesson demonstration files with each module.
- Exercise files for hands-on practice.
- A zip file containing all the course demo files (Lesson 1).
Important Notes:
- While we strive to teach Best Practice methods, please use these techniques responsibly and always keep backups of your work.
- Microsoft Excel is a dynamic application that receives regular updates. We will endeavor to keep the course content current; however, some features may evolve or appear as new updates are released.
Embark on a journey to data mastery with "PivotTables: From Slicers to Dashboards." Enroll today and transform your approach to data analysis! 🌟💻
Course Gallery


Loading charts...