Pivot Tables Playground for Business Users

Why take this course?
🚀 Course Title: Pivot Tables Playground for Business Users 📊
Headline: Unlock the Power of Data with Excel Pivot Tables: Master the Art of Insightful Analysis and Reporting!
Introduction: Are you a business professional who's drowning in data but craving insights? Do you find yourself repeating the same reporting tasks day after day? It's time to change the game with Pivot Tables Playground for Business Users—a comprehensive course designed to transform the way you analyze and report data. With Excel PivotTables, you can pivot (pun intended!) towards more efficient and insightful data handling. Say goodbye to manual reporting and hello to dynamic analysis that saves you time and provides deeper business insights.
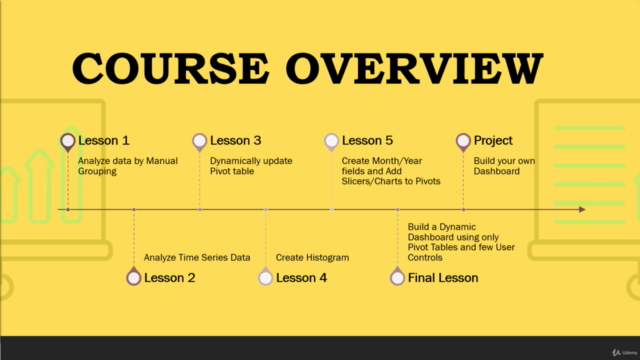
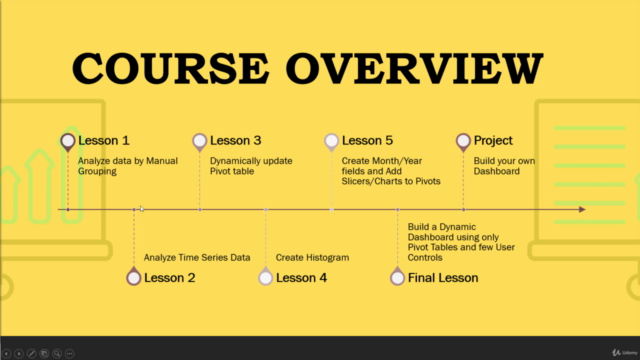
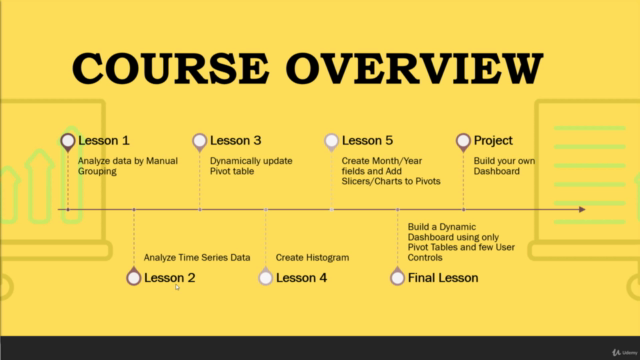
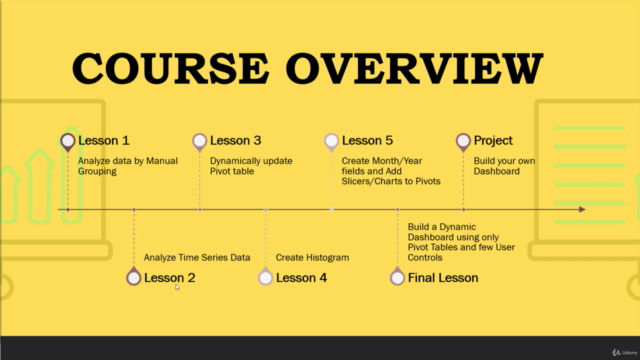
What You'll Learn: 🚀 Essentials of Excel Pivot Tables:
- Understand the core concepts behind Pivot Tables.
- Set up your first Pivot Table with confidence.
- Explore the different layouts and designs for optimal data presentation.
🧠 Advanced Data Analysis Techniques:
- Master complex data manipulation with Pivot Tables.
- Learn to create sophisticated data summaries and insights.
- Discover hidden functionalities that will make your analysis sing!
🔄 Reporting Automation:
- Build self-updating dashboards that give you real-time insights.
- Create interactive reports that can answer new questions as they arise.
- Reduce repetitive tasks by setting up automated report generation.
📈 Dashboard Creation and Customization:
- Craft intuitive, informative dashboards tailored to your business needs.
- Learn best practices for dashboard design for maximum impact.
- Understand how to interpret and act on the data presented by your dashboards.
Course Highlights: ✅ Hands-On Learning: Engage with real-world scenarios and exercises that mimic business challenges.
✅ Step-by-Step Guidance: No prior experience required—our expert instructor, Kunaal Naik, will guide you through each step with clear explanations and tips.
✅ Interactive Exercises: Apply what you learn with practical exercises that reinforce your new skills.
✅ Exclusive Resources: Gain access to additional materials and templates to support your learning journey.
Who Is This Course For? 👩💼 Business Analysts, 👨💼 Data Analysts, 📊 Financial Controllers, 🔧 Operations Managers, 💼 Any Business User Looking to Leverage Data for Better Decision-Making.
Why Join?
- Efficiency: Learn how to handle complex datasets with ease.
- Insight: Uncover patterns and trends in your data that can drive business decisions.
- Impact: Make a tangible difference in how your organization uses data.
- Confidence: Become the go-to person for data analysis within your team.
Enroll Now and Transform Your Data into Decisive Action! 📅✨ Join Kunaal Naik in this dynamic learning adventure and become a Pivot Table Power User. Don't let data overwhelm you—harness its power to inform, influence, and innovate within your business. Enroll in "Pivot Tables Playground for Business Users" today and step into a future where your data not only speaks but sings the story of your business's success! 🎶🎉
Course Gallery


Loading charts...