Stocks and Currency Visualization in Angular 9.x

Why take this course?
📈 Master Stocks and Currency Visualization in Angular 9.x with Highcharts Highstock!
Are you ready to transform your Angular applications into dynamic, interactive financial dashboards? Whether you're a developer looking to enhance your finance apps or an aspiring data visualizer intrigued by the stock market and currency trends, Stocks and Currency Visualization in Angular 9.x is the course for you!
Course Overview:
In this comprehensive course, led by industry expert Pravinkumar Dabadera, you will dive deep into the world of financial data visualization using the powerful Highcharts Highstock library within the Angular ecosystem. You'll learn how to create captivating charts that not only display live and historical data but also allow for meaningful comparisons between different stocks and currencies.
Why Take This Course?
✅ Learn with Real-World Data: Work with real-time and historical financial data, enabling you to create visualizations that are both informative and engaging.
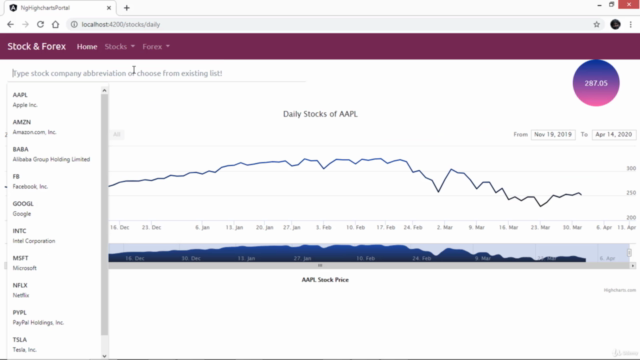
✅ Interactive Features: Implement search functionality for companies in stock visualization and for currencies in forex visualization, enhancing user interaction.
✅ Candlestick & OHLC Charts: Learn to visualize stocks using candlestick charts and OHLC (Open-High-Low-Close) charts, which are essential for traders and analysts.
✅ Customization Capabilities: Customize your Highstocks chart with a variety of options to make your dashboards stand out.
What You Will Learn:
-
Integration Mastery: Effortlessly integrate the Highcharts library into your Angular Single Page Application (SPA).
-
Dynamic Data Handling: Display live and historical financial data in a way that's both accurate and visually appealing.
-
Comparative Analysis: Compare different company stocks and country currency exchange trends to provide valuable insights.
-
Interactive Elements: Enhance user engagement by providing search capabilities within your visualizations.
Course Highlights:
-
Step-by-Step Guidance: From setting up your development environment to deploying your finished project, follow along with clear, concise instructions.
-
Hands-On Experience: Apply what you learn in real-time as you build out features for stock and currency visualization.
-
Best Practices: Understand the design principles and performance considerations that make for a robust financial dashboard.
-
Expert Support: Get answers to your questions from Pravinkumar Dabadera, who brings a wealth of knowledge in Angular and data visualization.
Who Is This Course For?
-
Web Developers looking to add financial data visualization to their skillset.
-
Angular developers aiming to enhance their applications with live stocks and currency charts.
-
Data Analysts or Business Intelligence professionals who want to present financial data more effectively.
-
Entrepreneurs and Startups building fintech applications that require real-time financial data representation.
Ready to Visualize Financial Data Like a Pro?
Join us in this journey to master Angular 9.x and Highcharts Highstock for stocks and currency visualization. With this course, you'll not only understand the technicalities but also be able to present financial data in a way that stands out. Enroll now and start your journey towards becoming an expert in financial data visualization!
👉 Transform your Angular apps with the power of Highcharts - Enroll today and lead the visualization race in finance applications! 📊
Course Gallery


Loading charts...