New Reporting Features in Excel 2013
Why take this course?
📊 Master Data Visualization with Excel 2013's New Reporting Features
🚀 Course Headline: "Create Great Looking Dashboards with the New Reporting (and a Few Other) Features in Excel 2013"
👨💻 Your Instructor: Matthew Bernath, an Excel expert with years of experience in data analysis and visualization.
📆 Course Description:
Are you ready to harness the power of Excel 2013's new reporting features to transform your data into compelling dashboards? Whether you're a seasoned professional or just getting started, this comprehensive course will guide you through the exciting changes from previous versions. With New Reporting Features in Excel 2013, you'll explore:
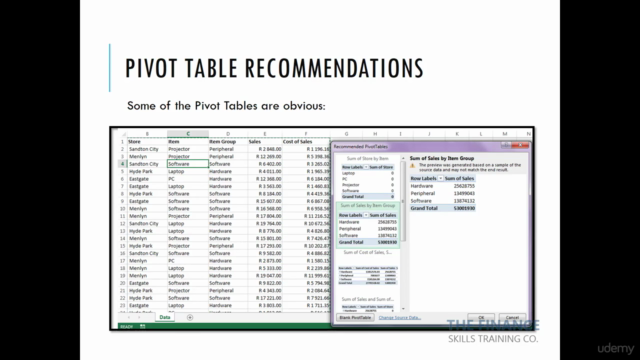
- PivotTables: Dive deep into your data with enhanced PivotTable functionalities that allow for more intuitive analysis and reporting.
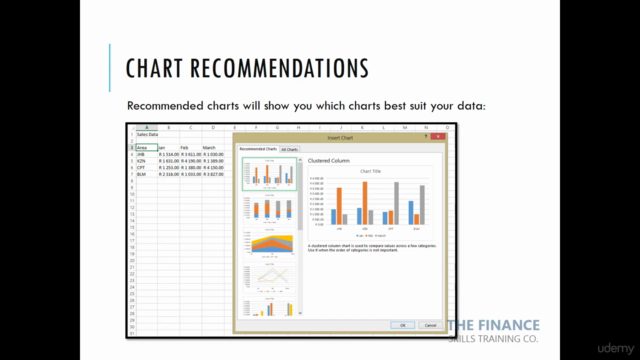
- Recommended Charts: Discover the smart way to visualize your data, as Excel suggests the most effective chart types based on your data set.
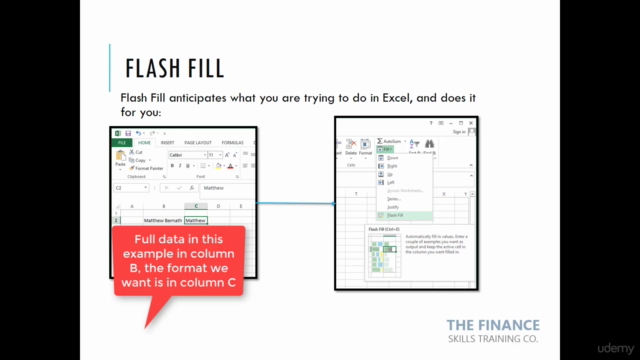
- Flash Fill: Learn how this game-changing feature can automate complex data tasks, saving you time and effort.
🚀 Why Take This Course?
- Upgrade Ready: If you're transitioning from Excel 2010 (or older versions), this course is your perfect onramp to understanding the new features.
- Practical Skills: Get hands-on with practice workbooks that complement the lessons and solidify your learning.
- Future Forecast: Get a sneak peek at the forecast functionality in Excel 2016, giving you a competitive edge.
🎓 Key Takeaways:
- Understand and utilize the new reporting features in Excel 2013 to create dynamic dashboards.
- Master PivotTables with advanced filtering and sorting capabilities.
- Leverage Recommended Charts to make data visualization decisions with confidence.
- Automate repetitive tasks with Flash Fill, enhancing your productivity.
- Get a preview of the upcoming Forecast functionality in Excel 2016.
📅 Enroll Now and transform the way you handle data! With New Reporting Features in Excel 2013, you'll not only make sense of complex data sets, but you'll also present your findings with clarity and confidence. Whether it's for business intelligence, financial reporting, or any other analytical endeavor, this course is your stepping stone to becoming an Excel power user.
🌟 Special Bonus: Upon completing the course, you will receive exclusive access to additional resources and templates to help you continue honing your skills.
Don't miss out on the opportunity to stay ahead of the curve with Excel 2013's advanced reporting features! 📈
Course Gallery
Loading charts...