Power BI A-Z: Hands-On Power BI Training For Data Science!

Why take this course?
📊 Power BI A-Z: Hands-On Power BI Training For Data Science! 🚀
Are you ready to unlock the secrets of data and turn it into actionable insights? With our comprehensive "Power BI A-Z" course, you'll dive deep into the world of data science and analytics using Microsoft Power BI. This isn't just another course—it's a transformational journey that will empower you to make informed decisions and drive success for yourself or your organization.
Why Learn Power BI? 🤔
Power BI is an essential tool for anyone involved in data analysis, business intelligence, and data visualization. It allows users to connect to various datasets, analyze the data, and visualize it in compelling ways that can lead to smarter decisions. From understanding customer behavior to identifying sales trends or optimizing production processes, Power BI equips you with the ability to transform raw data into impactful visualizations.
What You'll Learn: 🎓
-
Data Connectivity: Begin by mastering how to connect Power BI to different datasets and understand the intricacies of data import and export processes.
-
Advanced Data Exploration: Discover how to drill down into your data to uncover deeper insights, calculate statistics directly within Power BI, and manipulate visualizations to get a closer look at what matters most.
-
Visualization Techniques: Learn to represent complex datasets in various forms—from charts to plots, and even interactive dashboards that bring your data to life.
-
Data Preparation Skills: Tackle real-world exercises that challenge you to clean, transform, and prepare your data for analysis, ensuring that your insights are based on accurate information.
-
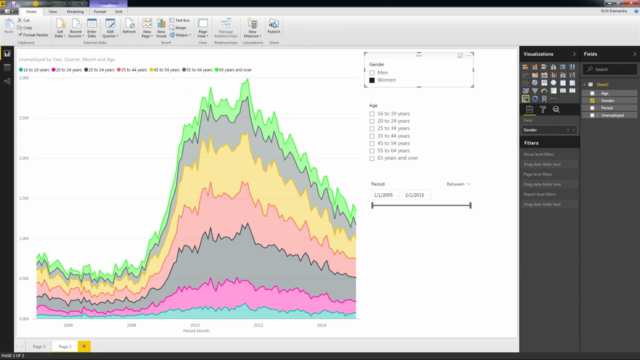
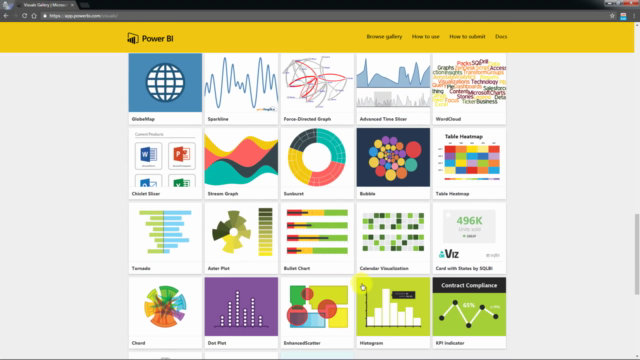
Custom Visualizations: Explore the creative side of Power BI with advanced custom visuals such as histograms, brickcharts, and more, to tell a compelling story through your data.
Course Structure & Independence: 🖥️
With this course, you have the freedom to learn at your own pace and according to your own interests. Each module is designed to be independent, so you can choose where to start or jump straight into a topic that interests you most. Every section comes with new datasets and hands-on exercises to apply what you've just learned in real-time.
Stay Current with Power BI Updates: 🏁
As Microsoft Power BI evolves, so does our course content. We ensure that all users can return to the course and keep their skills sharp, staying ahead of the curve and ahead of the competition.
Course Breakdown:
-
Power BI Basics: Get acquainted with the Power BI interface, connect to a data file, and export your first report, ensuring even novices are comfortable from the start.
-
Analyzing Data Trends: Learn to work with hierarchies, timeseries, and aggregations to identify patterns and make accurate forecasts within your datasets.
-
Data Visualization Techniques: Master the art of creating various charts, maps, scatterplots, and interactive dashboards that will bring clarity and insight from your data.
-
Combining Data Sources: Discover how to merge multiple data sources into a single analytical viewpoint, blending disparate pieces of information to create a comprehensive picture.
-
Custom Visualizations: Dive into the advanced world of custom visuals, learning to create histograms, brickcharts, and more to highlight critical data insights.
Your Future as a Data Scientist: 🔍
Upon completing this course, you'll be equipped with the skills of a proficient Power BI user. You'll harness the power of data science to extract meaningful insights from complex data sets, analyze and visualize information with ease, and present your findings in a way that drives decision-making. Whether you're looking at scientific datasets or aiming to predict buying trends for increased profits, this course will set you up for success.
Enroll now and embark on a journey to master Microsoft Power BI and become a data science expert! 🚀💻📈
Course Gallery


Loading charts...
Comidoc Review
Our Verdict
This course offers solid training for those seeking to learn Power BI by mastering its essential features. However, expect notable discrepancies between the outdated course material and the ever-evolving Power BI platform. As a result, learners may find themselves spending extra time adjusting to version changes and navigating through tutorials with older interface elements. Moreover, although hands-on experience is valuable, deepening the focus on practical applications beyond visualization creation would enhance users' comprehension of Power BI’s data analysis capabilities in real business scenarios.
What We Liked
- Comprehensive coverage of Power BI fundamentals, catering to both beginners and those with some familiarity
- Engaging instructional approach that explains each step clearly, making it easy for learners to grasp complex topics
- Hands-on experience using real datasets and visualizations ensures practical understanding
- Well-structured curriculum that builds on foundational knowledge, progressively enhancing your Power BI skills
Potential Drawbacks
- Aging course content: tutorials and visual examples don't reflect the latest Power BI updates or features
- Inadequate theoretical overview; some users express the need for a clear conceptual introduction before delving into software navigation
- Navigation challenges in the newer versions of Power BI due to outdated course content
- Limited focus on real-life case scenarios, such as manual data joining and missing value treatment