Design modern UX Dashboard with Microsoft Power BI
Why take this course?
🌟 Take Your Dashboard Design and Reporting Skills to the Next Level with Microsoft Power BI 🌟
Course Overview 🚀
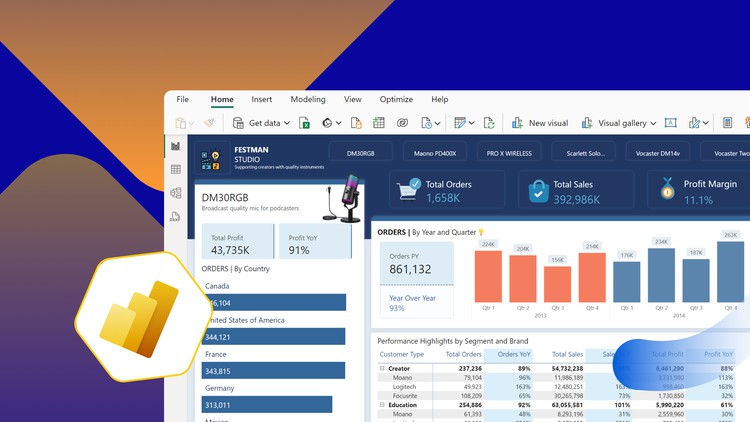
Welcome to an immersive journey into the world of modern dashboard design and reporting with Microsoft Power BI! As a participant in this comprehensive course offered by FestMan Learning Hub, you'll be stepping into the shoes of a seasoned Business Intelligence Analyst at Festman Studio, a globally recognized brand in premium recording equipment for content creators.
Throughout this course, you'll have your hands-on keyboards, transforming raw data into compelling narratives that drive business decisions. You'll learn to leverage the full power of Power BI to turn numbers and statistics into actionable insights, making a tangible impact on Festman Studio's strategic direction.
Project Background 📊
As a Business Intelligence Developer at Festman Studio, you are tasked with a pivotal role: to use Microsoft Power BI as your canvas to craft reports and dashboards that resonate with decision-makers. Your mission is to analyze the influx of data, pinpoint trends, predict outcomes, and ultimately guide Festman Studio toward sustained success and market dominance.
Task 🔧
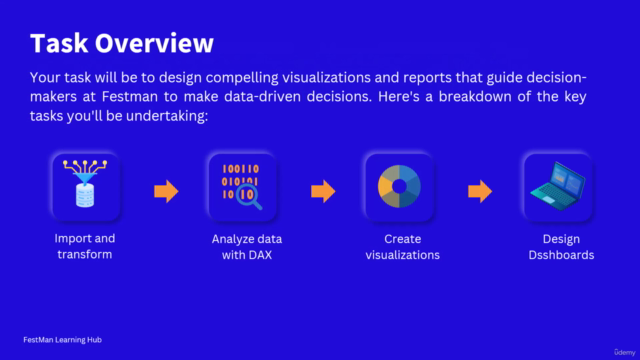
Here's what you will be doing in this course:
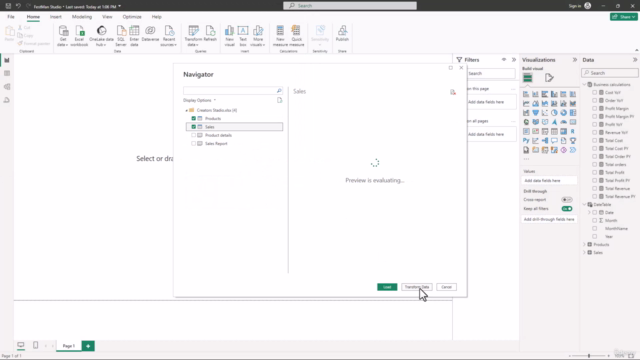
- Import Data: Kickstart your analysis by bringing two critical datasets into Power BI.
- Profile and Transform Data: Cleanse the data, ensuring accuracy and reliability for your insights.
- Analyze Data with DAX: Calculate key metrics that will provide a deeper understanding of the business landscape.
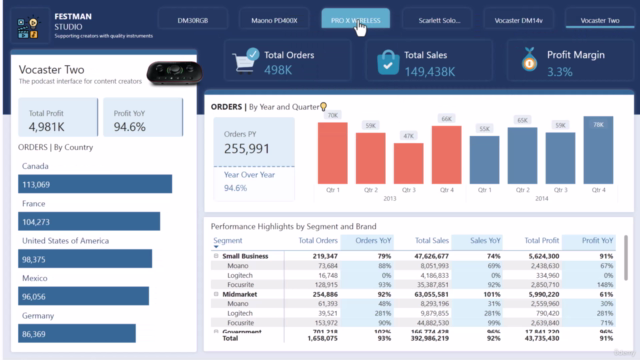
- Visualize Data: Bring your insights to life through impactful visualizations that tell a story.
- Design Dynamic Dashboards: Create an interactive dashboard that summarizes all your findings, offering an at-a-glance view for stakeholders.
Learning Objectives 🎓
Upon completing this course, you will have mastered the following skills:
- Data Importing & Transformation: Master the art of importing datasets into Power BI, cleaning, and transforming the data to ensure it's ready for analysis.
- Data Analysis with DAX: Gain proficiency in using Data Analysis Expressions (DAX) to calculate complex metrics that drive business decisions.
- Visualization Creation: Learn to create visualizations that not only display data but also tell a compelling story about the data.
- Dashboard Design & Implementation: Design and implement interactive dashboards in Power BI that provide dynamic insights and facilitate better decision-making for stakeholders.
By the end of this course, you will be equipped with the tools and skills to design modern reports and dashboards with Power BI, taking your UX dashboard design abilities to the next level. Get ready to elevate your data storytelling game and become a pivotal player in the field of Business Intelligence! 💼✨
Course Gallery
Loading charts...