Microsoft Visio Introduction: Turn Information into Graphics
Why take this course?
🚀 Microsoft Visio Introduction: Master the Art of Data Visualization! 📊🎨
Are you ready to transform your data into compelling visuals? 🤔✨
Whether you're new to Microsoft Visio or an experienced user seeking to sharpen your skills, this course is tailored to meet your needs. It's designed to elevate your understanding of the software and provide you with a comprehensive set of tools to effectively translate complex data into easy-to-understand graphics, diagrams, charts, and support Business Process Model and Notation (BPMN) projects.
Why Choose ZandaX for Your Visio Training? 🏅🚀
With every ZandaX Microsoft course, you'll receive a detailed workbook and exercises. These are specifically crafted to allow you to practice and perfect the techniques taught. Plus, our seasoned Microsoft-certified instructors bring real-world experience and years of classroom teaching expertise to ensure you receive top-notch guidance. 🧠🖥️
We understand your time is valuable. That's why our courses are packed with concise, focused video lessons that get straight to the point. No fluff, just the essential knowledge you need to become proficient in Visio. ⏱✨
Key Topics You'll Master:
- Using the Visio Interface: Get familiar with the workspace and tools.
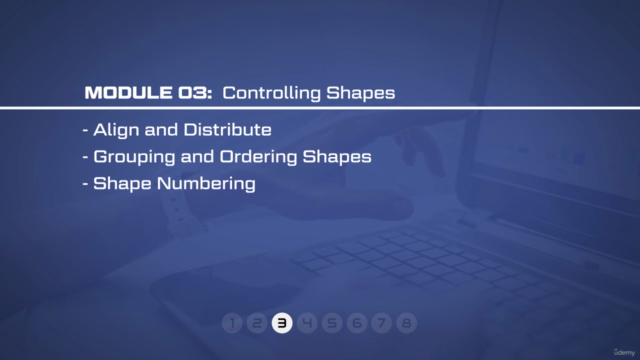
- Shapes & Stencils: Learn how to use shapes effectively to build your diagrams.
- Working with Text: Communicate your data clearly with text elements.
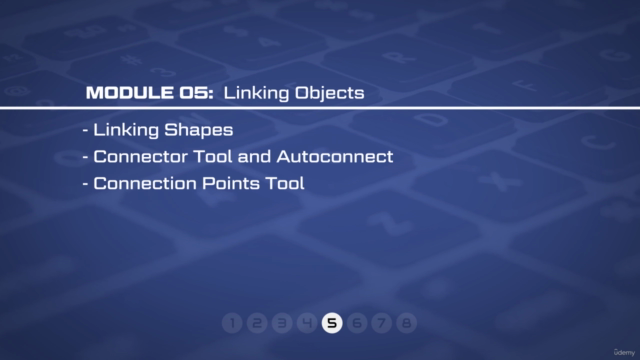
- Linking Objects: Create dynamic diagrams by linking objects together.
- Flowcharts & Process Diagrams: Design clear workflows and processes.
- Finishing Your Diagram: Add the final touches to your visuals for maximum impact.
- Organization Charts: Illustrate organizational structures and relationships.
Course Highlights:
- Self-Paced Learning: Access lectures at your own pace, diving into topics as needed.
- Reference Library: Use the course as a resource to revisit any topic anytime.
- Tailored for New Visio Users: Designed to get you up and running quickly with Visio.
- Practice Makes Perfect: Apply your skills using downloadable workbooks and exercises in the "General Introduction" module.
What You'll Gain:
Upon completing this course, you'll be equipped to create professional-looking diagrams that will significantly enhance the impact of your documents and reports. 📈🖌️
- Enhance Document Impact: Turn data into visually appealing diagrams and charts.
- Improve Clarity & Communication: Make complex information easily understandable.
- Support BPMN Projects: Visualize business processes with ease.
- Add Value to Your Resume: Showcase your new Visio expertise!
Don't Miss Out! 🎫🎉
This course is much more than a collection of videos; it's a comprehensive learning experience that will take your data visualization skills to the next level. With ZandaX, you won't find better value for your professional development. Enroll today and unlock the full potential of Microsoft Visio! 🌟💻
Ready to dive into the world of Microsoft Visio? Click that 'Enroll Now' button and join hundreds of professionals who have enhanced their reporting and presentation skills with ZandaX. Let's bring your data to life! 🚀🎓
Course Gallery
Loading charts...