How to Create and Manage Diagrams with Microsoft Visio

Why take this course?
🎓 **Master Visual Communication with Microsoft Visio 🚀 Course Title: How to Create and Manage Diagrams with Microsoft Visio
Are you ready to unlock the full potential of your data and processes through powerful visual tools? Stephen Saxton brings you an in-depth journey into the world of Microsoft Visio, where you'll learn to transform raw information into compelling diagrams, flowcharts, and more!
🖥️ Course Headline: "Elevate Your Projects with Professional Diagrams using Microsoft Visio – The Ultimate Tool for Visualizing Data and Processes!"
📑 Course Description: Microsoft Visio is an indispensable tool for anyone looking to create detailed diagrams, flowcharts, organizational charts, network diagrams, and more. In this comprehensive course, you'll dive into the intricacies of the Microsoft Visio interface, master the art of shape manipulation, and perfect your diagram design skills.
From the basics of working with shapes and connectors to advanced techniques like creating custom stencils and linking external data, How to Create and Manage Diagrams with Microsoft Visio covers it all. You'll learn how to:
-
Understand the Visio Interface: Get familiar with the layout and features that will guide your diagramming journey.
-
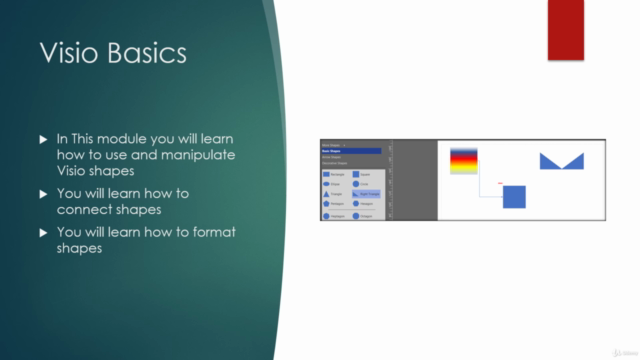
Shape Mastery: Learn to create, modify, and format shapes with precision, ensuring your visuals are clear and impactful.
-
Data Integration: Discover how to use data effectively to automate the creation of flowcharts, organizational charts, and Gantt charts.
-
Advanced Diagram Types: Explore specialized diagrams like project schedules, timelines, pivot diagrams, floor plans, and more.
-
Data Graphics and Excel Integration: Link external data sources to your Visio diagrams for dynamic, up-to-date visualizations, and learn to create custom reports in Excel that feed directly into your diagrams.
-
Custom Shape Creation: Step-by-step instructions on how to design your own stencils and shapes to solve unique challenges.
By the end of this course, you'll not only be proficient in creating professional-looking diagrams but also skilled at managing and updating them as needed. Your presentations and reports will stand out, making data accessible and engaging for any audience.
🛠️ Key Takeaways:
-
Basic Shapes and Connectors: Master the fundamentals of shapes and connectors to build a solid foundation.
-
Flowchart Generation: Learn to create and manage flowcharts with shape data, making your processes clear and actionable.
-
Organizational Charts: Synchronize shapes and use off-page references to represent hierarchies effectively.
-
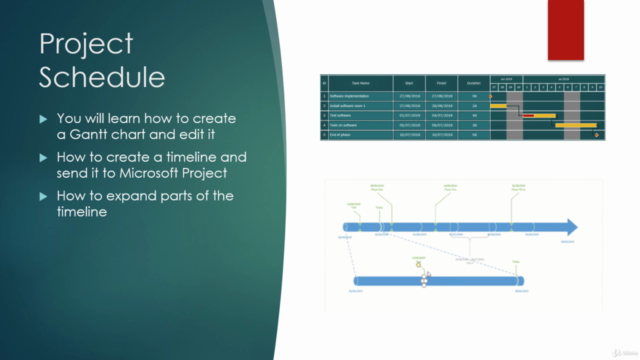
Project Schedules and Timelines: Utilize Gantt charts to visualize project timelines and deadlines.
-
Pivot Diagrams: Understand how to visualize complex data structures with pivot diagrams.
-
Floor Plans: Create detailed floor plans, office layouts, and even garden designs with ease.
-
Maps and Charts: Transform geographical data into maps and charts for better understanding and presentation.
-
Excel Integration: Learn how to link your Visio diagrams directly to Excel for a seamless experience.
-
Custom Shape Creations: Design your own shapes and stencils to tailor your diagrams to specific needs.
-
Data Graphics: Use data graphics to visualize and present external data within your diagrams.
🚀 Why Take This Course?
-
Practical Skills: Gain hands-on experience with real-world scenarios that will enhance your professional capabilities.
-
Versatile Learning: Suitable for beginners, intermediate users, and advanced Visio enthusiasts looking to expand their knowledge.
-
Enhanced Productivity: Learn shortcuts and tips to save time and increase efficiency in your diagramming tasks.
-
Certification Opportunity: Complete the course with a certificate of completion that showcases your newfound expertise in Microsoft Visio.
Join Stephen Saxton on this enlightening course and become a visual communication superstar! 🌟
Enroll Now and Transform Your Diagramming Skills with Microsoft Visio! 📈💖
Course Gallery


Loading charts...