Microsoft SQL Server Reporting Services (SSRS)

Why take this course?
🚀 Course Title: Microsoft SQL Server Reporting Services (SSRS): 2022 Edition 📊
Course Headline:
Dive into Data Visualization with MS SQL Server Reporting Services (SSRS)! 🎓
Course Description:
✨ Reviews:
- "This tutorial is brilliant! It will definitely save you hours of figuring out things yourself." -- Koos ten Bras
- "Excellent course, well presented with clear examples." - Peter Cawthorne
- "Excellent Course, I just started a new job and after doing this course I now understand what I am looking at and working with — a fully built-up report." -- Bjorn
Join Phillip Burton as he guides you through the process of creating impactful reports in SQL Server Reporting Services (SSRS). This comprehensive course has been meticulously updated, featuring the latest tools and techniques using Visual Studio 2022. No prior knowledge is required, but having some familiarity with T-SQL will be a significant advantage.
Course Outline:
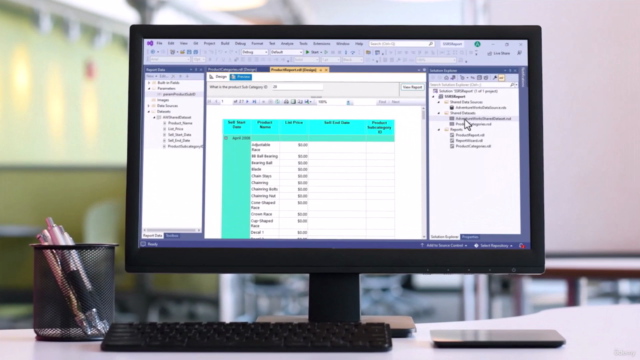
🔹 Getting Started: We'll kick off by downloading a version of SQL Server which includes SSRS at no cost and exploring the AdventureWorks database that we'll use in our reports. This sets the foundation for the practical skills you're about to learn.
🔹 Designing Reports:
- Select and configure various report components, including matrix, table, chart, and more data visualization tools.
- Identify the data source and parameters essential for your report's data flow.
- Design a robust grouping structure to organize and analyze your data efficiently.
- Learn to create interactive drilldown and drillthrough reports that allow users to explore data layers.
🔹 Implementing Report Layout:
- Master formatting techniques for colours, dates, and numbers to ensure your report is visually appealing and easy to read.
- Configure the page layout to suit your data presentation needs.
- Add headers and footers to provide context and essential information to your reports.
- Implement advanced data regions like matrices, tables, charts, images, indicators, maps, and groupings within your reports.
- Define custom fields and expressions to tailor your report's functionality and output.
- Utilize global collections to manage consistent report elements across multiple pages or reports.
🔹 Adding Interactivity:
- Create drilldown and drillthrough reports for a more immersive data experience.
- Implement interactive sorting and filters to give users control over the data they view.
- Explore parameters, including multi-value parameters, to refine report output based on user input.
- Produce dynamic reports using parameters for a tailored data view.
- Implement the show/hide property to display or hide specific parts of your report based on conditions.
- Add actions, such as jump to report and URL links, to enhance user interaction.
- Incorporate fixed headers and a document map to improve navigation within your reports.
By the end of this course, you will be empowered to:
- Create, design, and implement reports in SQL Server Reporting Services (SSRS) confidently.
- Develop your skills step by step, from selecting components to adding interactive elements.
- Present data in a variety of formats using SSRS tools and features.
- Enhance the usability of your reports with advanced interactivity options.
- Utilize the latest version of SSRS (2022) with Visual Studio for real-world application development.
Embark on your journey to becoming an SSRS expert today! 🌟
Course Gallery


Loading charts...
Comidoc Review
Our Verdict
This SSRS course is an excellent starting point for understanding report design, layouts, and interactivity in Microsoft SQL Server Reporting Services. It provides a well-rounded experience even though occasional issues arise with subtitles and formatting. The valuable insights and ample practice opportunities make it an engaging learning resource, despite minor pacing concerns that can be addressed with personal note-taking or rewatching certain sections.
What We Liked
- The course offers a comprehensive overview of Microsoft SQL Server Reporting Services (SSRS) and is directly applicable to Power BI Report Builder.
- Phillip Burton's instruction excels with clarity, engaging content, and up-to-date materials, making the learning process enjoyable.
- The practice exercises help reinforce concepts and there are valuable insights for both beginners and experienced users.
- Students appreciate real-world examples of correct and incorrect implementations, along with explanations on how to fix mistakes.
Potential Drawbacks
- Subtitles occasionally fall out of sync or contain errors, causing confusion about the content being presented.
- Formatting inconsistencies arise in certain lessons, such as multiple voice-overs playing simultaneously or abrupt transitions between topics.
- Some students find the pace too fast for comfortable comprehension and sometimes have difficulty following along with the instructor's actions.
- Occasionally outdated content might cause confusion when relating to current software versions.