Power Bi Data Analysis - Create Dashboards in Power Bi - P1

Why take this course?
🌟 Master Microsoft Power Bi with Our Comprehensive Online Course! 🌟
Power Bi Data Analysis & Data Visualization - Learn Business Intelligence
Are you ready to unlock the full potential of your data and transform it into actionable insights? Learn Power BI - Analyze & Visualize Data with Power Bi is the perfect course for anyone looking to master data analysis and visualization using one of the most powerful business intelligence tools out there – Microsoft Power BI.
Course Overview:
This course is designed to provide you with a comprehensive skillset to create dynamic reports and interactive dashboards. We delve into real-world scenarios, ensuring that by the end of this course, you'll be equipped to interpret data meaningfully using Power BI.
What is Power BI?
Power BI 📊 is a business analytics and business intelligence service by Microsoft, offering interactive visualizations with an interface that's accessible for all users – from analysts to executives. It's part of the Microsoft Power Platform, which empowers everyone across your organization to dives deep into data to deliver insights that drive action.
Your Journey with Power BI Desktop:
- Connect to Data: Power BI Desktop can link to over 65 on-premises and cloud data sources, turning raw data into rich, interactive visuals.
- Data Preparation: Use Power Query to extract, profile, clean, transform your data, and build a relational data model.
- Advanced Data Modeling: Optimize data models, create DAX measures, and analyze trends and patterns.
- Visual Analytics: Design compelling reports, dashboards, and charts using the various visualization techniques available in Power BI Desktop.
- Share Insights: Make your reports and dashboards accessible to others using the Power BI service within or outside of your organization.
What You Will Learn:
- Power Bi DAX: Master the language of data analysis expressions to perform complex calculations.
- Power Query: Learn to use this powerful tool for data preparation and transformation.
- Power Bi Charts & Graphs: Understand how to effectively present your data visually.
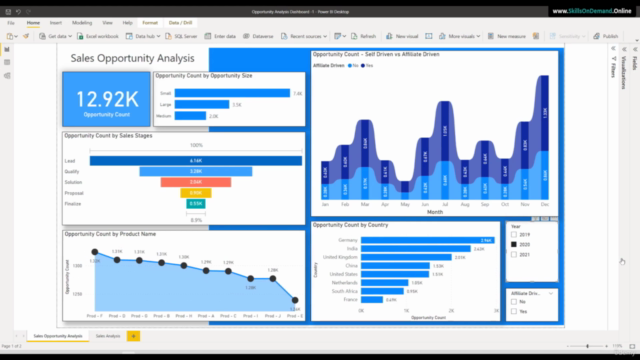
- Interactive Dashboards: Build a multi-page Sales Opportunity Analysis dashboard, learning best practices for interactivity and user engagement.
Step-by-Step Learning Experience:
- Power BI Desktop & Query Editor: Gain hands-on experience with creating relationships between data sources, building data models, and using DAX formula language.
- DAX Formulas: Learn to create custom measures and powerful calculations that will provide deep insights into your data.
- Report Creation: Master the art of creating interactive reports with filters, drill-throughs, and relative date filters.
- Custom Visualizations: Enhance your reports with themes and custom visualizations for a more professional look and feel.
By the end of this course, you will be able to:
- Analyze data from various sources to extract meaningful insights.
- Create interactive dashboards that provide users with real-time data access.
- Implement complex calculations using DAX.
- Develop engaging reports that cater to different user needs and preferences.
Ready to Elevate Your Data Skills?
With our expertly crafted lessons, real-world examples, and hands-on exercises, you'll be on your way to becoming a Power BI guru. 🚀
So, what are you waiting for? Join us now and embark on a journey to transform data into impactful visual narratives with Power BI! Let's turn your data into stories that matter. 📈✨
Course Gallery


Loading charts...