Microsoft Power BI: DA-100 Data Analytics using Power BI

Why take this course?
🌟 Master Microsoft Power BI: DA-100 Data Analytics Course 🌟
Course Headline:
Transform, analyze & visualize data with the hottest analytical software in the market - Microsoft Power BI Desktop!
Overview: If you're on the lookout for hands-on training to learn Microsoft Power BI or prepare for the DA-100 exam, this course is tailor-made for you. 🚀 In a world where data is king and omnipresent, Power BI stands out as the analytical software that transforms raw data into actionable insights. Whether your data resides in excel sheets or sprawls across extensive data warehouses—be they cloud-based or on-premise—Power BI can handle it all with finesse.
Why Learn PowerBI? 🤔 Power BI is not just another analytics tool; it's a comprehensive suite of Business Intelligence tools designed to streamline your data analysis goals. Here's why you should consider mastering Power BI:
- Ease of Use: 🎨 With its intuitive drag-and-drop interface and a plethora of chart types, Power BI is user-friendly and perfect for creating stunning visualizations to make sense of your data.
- Ease of Sharing: 🤝 Share your findings with anyone, within or outside your organization, without complex processes.
- Ease of Understanding: 🗣️ Utilize natural language processing to create reports and make data-driven decisions simpler than ever.
- Powerful Tool: ⚡ PowerBI leverages the power of Power Query for data modeling, requiring no new language skills from you.
- Omnipresence: 🌍 Access your dashboards on any device—mobile, tablet, or laptop—and enjoy full compatibility across all operating systems.
Career in PowerBI: 🌉 The demand for Power BI professionals is skyrocketing, and with it, the career opportunities. As a Power BI Developer or Analyst, you can earn an average of $117,000 per year. The prerequisites for this lucrative role are within your reach.
What You’ll Learn / Course Objectives: 🚀 Our comprehensive course is designed to equip you with the skills needed to excel in the field of data analytics. Here's what you can expect to learn:
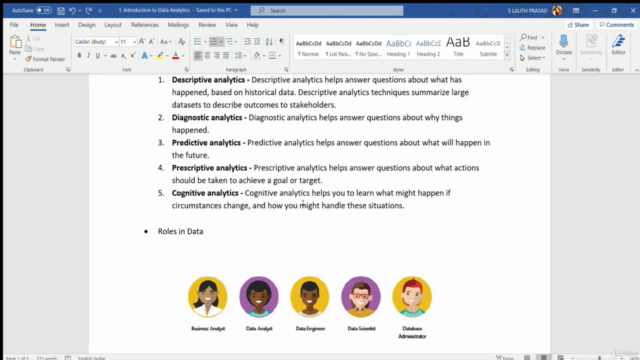
- Understanding Data Roles: 👨💻 Identify different roles within the data space and understand the tasks performed by a Data Analyst.
- Power BI Landscape: 🌟 Familiarize yourself with the Power BI products and services ecosystem.
- Data Connections: 🔗 Learn about various connection methods and their performance implications.
- Data Shaping: 🛠 Apply data shape transformations to refine your datasets.
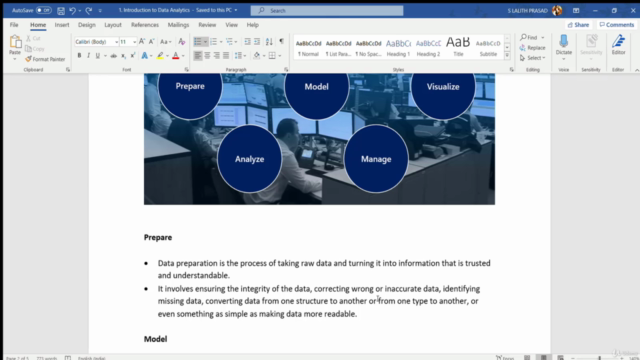
- Data Modeling Basics: 📊 Understand the fundamentals of data modeling.
- Defining Relationships: 🔗 Define and understand relationships, their cardinality, and how they impact your data analysis.
- Dimensions & Hierarchies: 📈 Implement Dimensions and hierarchies for more nuanced analysis.
- Visualizations: 📊 Create histograms, rankings, and select appropriate visualization types to represent your data.
- DAX Essentials: 🧠 Understand the basics of DAX and use it to create simple formulas and expressions.
- Time Intelligence & KPIs: 🕒 Work with Time Intelligence and Key Performance Indicators to track and analyze trends over time.
- Interactive Reports: 🖱️ Add report navigation, interactions, and configure data sources and datasets.
- Data Source Creation: 📚 Learn to create and configure a data source and dataset to start your analysis.
Enroll in this course today and unlock the full potential of Microsoft Power BI. Transform your career, analyze better, visualize smarter, and lead the way in data analytics! 💡🚀
Course Gallery


Loading charts...