Microsoft Excel: Data Reporting and Dashboards From Scratch!

Why take this course?
🎉 Microsoft Excel: Data Reporting and Dashboards From Scratch! 📊
Get the "Right Knowledge" to Master Your Data in Excel 🚀
Course Headline: Unlock the full potential of your data with our comprehensive course on Microsoft Excel. Dive into the fascinating world of Data Analytics by learning from the ground up. Our focus is to ensure you have a solid understanding of Excel's functionalities and how to apply them effectively in real-world scenarios. 📈
Course Description:
This course is your stepping stone into the realm of Data Reporting and Dashboards. It's designed to empower you with the foundational skills necessary to handle complex data tasks with confidence and precision. 🧠
"If you feel something is complicated or not your cup of tea, it's majorly because you tried jumping on advanced concepts rather than absorbing the basics first." - Unknown
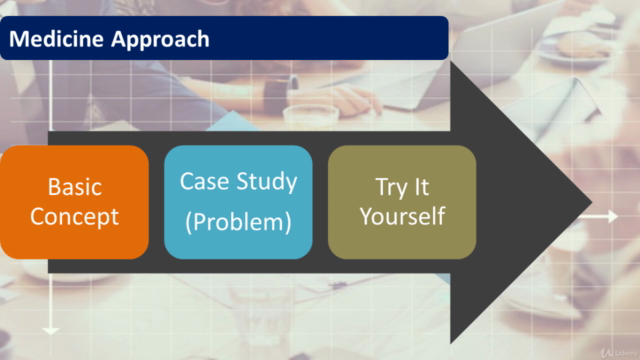
We believe in building knowledge from the ground up. This course is crafted to provide a thorough understanding of each concept, emphasizing the fundamental areas to ensure that you learn it correctly and can re-implement these skills when required. 🛠️
Our goal is not just to teach you certain functionalities of Excel; we aim to impart the right skills that are versatile and applicable across various data challenges. We're here to transform the way you think about and work with Excel. 🎓
Course Structure:
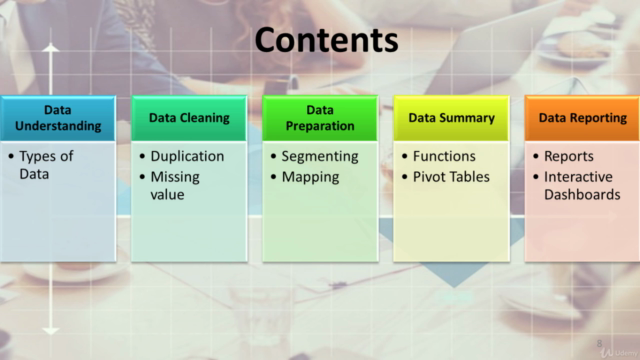
We've structured the course to cover all major Excel Concepts while explaining the principles of Data Reporting. Here's what you can expect:
- Data Understanding - Gain insights into your data using concepts that will help you frame your data effectively in Excel.
- Data Cleaning - Master tools like 'Go To Special', 'Remove Duplicates', and more to clean your data accurately.
- Data Preparation - Utilize various Functions such as VLookup, Text Functions, Date Functions, and Logical Functions to prepare your data for analysis.
- Data Summarizing - Learn how to use Functions and Pivot Tables to summarize your data succinctly.
- Data Presentation - Discover the art of presenting data using different chart types tailored to your specific requirements.
- Reporting & Dashboards - Create interactive Reports and Dashboards using Form/ActiveX controls and Pivot Table with Slicers.
Skills Acquired After Completing This Course:
Upon completing this course, you will be able to:
- Work confidently and efficiently using smart functionalities of Excel, saving time and effort.
- Create your own interactive Reports and Dashboards that can communicate your data effectively.
- Reimplement the concepts learned in this course to tackle different problems with ease.
- Prepare yourself for interview questions related to Microsoft Excel.
- Cultivate a newfound appreciation for Excel, potentially transforming it from a necessary tool into a skill you love using! 💫
We're excited about the journey you're about to embark on with our Microsoft Excel: Data Reporting and Dashboards From Scratch! course. We can't wait to hear your success stories and see how you transform your data into actionable insights. 🌟
Let's get started and turn your data into a story that matters! Sign up today and take the first step towards becoming an Excel pro! 🚀💻
Course Gallery


Loading charts...