Microsoft excel from beginner to expert

Why take this course?
🌟 Microsoft Excel Tutorial: From Beginner to Expert 🌟
Unlock the Power of Data with Microsoft Excel!
🎉 Course Headline: Master data analytics and visualization with the leading spreadsheet tool—Microsoft Excel!
Course Description:
Data doesn't just tell a story; it is the story. The key to unlocking the narrative within your data is using the right tool—and that's where Microsoft Excel shines. As an industry-leading software for data visualization and analysis, Excel empowers you to understand trends, patterns, and perform complex calculations with ease. Whether you're a student, a lecturer, or a professional in any field that involves data management, this course will guide you from the basics to mastering Excel's advanced features.
📈 What You Will Learn:
- Navigating Excel: We start with the fundamentals—opening Excel and understanding its platform.
- Customization: Learn to customize your ribbons for a more efficient workflow.
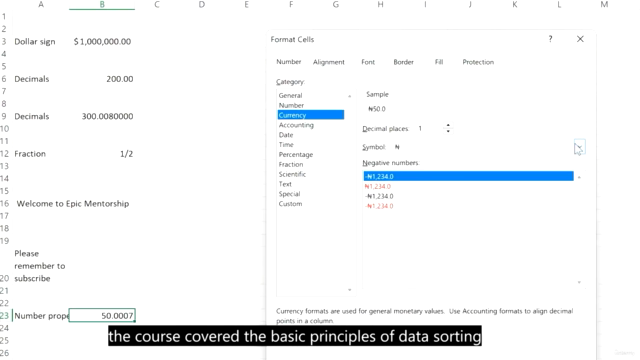
- Data Manipulation: Sort, transpose, format, and enhance your data with the Format Painter tool.
- Advanced Formulas: Dive into basic formulas, mean, median, mode, and even 3D formulas.
- Charts and Graphs: Plot various charts, including sparklines for a compelling data narrative.
- Tables and Analysis: Create dynamic tables, pivot tables, and pivot charts to analyze large datasets effortlessly.
- Dynamic Maps: Convert your data into interactive maps.
- Data Tools: From find and replace, hyperlinks, data validation, to creating dropdown lists—Excel has a tool for every need.
- Document Management: Learn how to convert Excel documents to PDFs, copy data to Word, add borders, and more.
- Protection and Security: Protect your sheets, organize with charts, and ensure your data with strong security measures.
- Efficiency and Shortcuts: With over 20 shortcut keys, the Camera tool, changing backgrounds, and converting Excel to PDF, you'll become an Excel ninja!
- Real-World Application: Explore tips and tricks in ten detailed parts to enhance your Excel experience.
Course Structure:
- Getting Started with Microsoft Excel
- Opening Excel
- Creating templates
- Overview of the Excel platform
- Customizing Your Excel Experience
- Customizing ribbons
- Sorting data
- Transposing data and adjusting cell sizes
- Data Formatting and Calculation
- Format painter tool
- Basic formulas (mean, median, mode)
- 3D formulas and showing formulas
- Advanced Data Analysis
- Fill series with cells
- Creating and working with tables
- Quick analysis and plotting charts
- Enhancing Charts
- Adding a second y-axis
- Forecast function in Excel
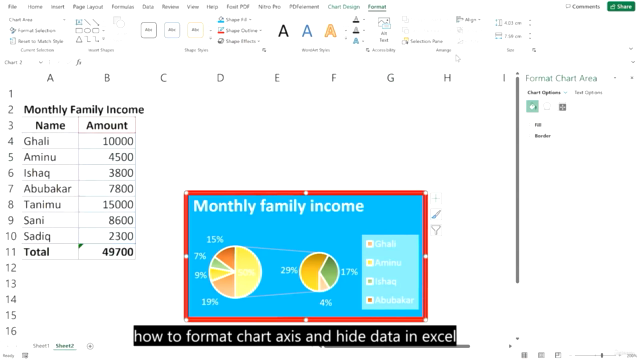
- Plotting pie charts and sparklines
- Working with Data
- Formatting chart axis
- Hiding data within Excel
- Pivot tables and pivot charts
- Advanced Data Tools
- Find and replace, hyperlinks, data validation
- Dynamic maps in Excel
- Converting PDF to Excel
- Document Management and Organization
- Header and Footer
- Separate names
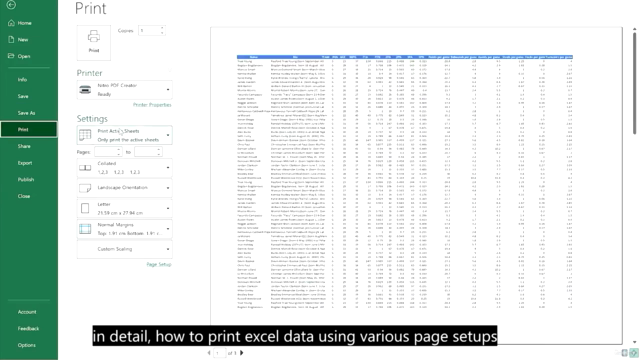
- Printing documents
- Creating Charts and Visualizations
- Organizational charts
- Protecting your Excel sheet
- Screenshots and Beyond
- Taking screenshots
- Excel free online access
- Tips and Tricks
- A series of ten parts with valuable shortcuts, tools, and techniques to enhance your Excel skills.
Join the Journey:
Embark on this comprehensive learning experience with Dr. Rasheed, a seasoned instructor who brings years of expertise in data analysis and visualization using Microsoft Excel. This course is designed to cater to all levels—from novices to those looking to refine their skills.
Thank you for choosing this course to elevate your proficiency in Excel. I am excited to be part of your learning journey and look forward to interacting with you throughout this experience. Let's unlock the full potential of your data together! 📊🚀
Course Gallery


Loading charts...