Business Intelligence and Data Visualisation in Excel 365

Why take this course?
🌟 Unlock the Power of Data with Business Intelligence and Data Visualisation in Excel 365! 🌟
Course Title:
Business Intelligence and Data Visualisation in Excel 365
Your Instructor: Wrikki Lahiri
A seasoned professional with a passion for transforming raw data into actionable insights, Wrikki brings years of experience in business intelligence, data analysis, and Excel mastery to guide you through this transformative learning journey.
Course Headline:
Master Power Pivot, Pivot Tables, Pivot Charts, Solver, What-If Analysis, and More!
Course Description:
Embark on a comprehensive journey to master Excel as a tool for Business Intelligence (BI) and Data Visualisation. This course is tailored for aspiring business intelligence analysts, business analysts, and anyone eager to delve into the world of data analysis with Excel. We'll unlock the full potential of Excel 365's BI capabilities through practical, hands-on learning using real-world sample datasets.
By the end of this course, you'll be equipped with a robust set of skills to:
- Analyse and interpret complex data sets.
- Understand trends and patterns.
- Utilise advanced Excel BI tools.
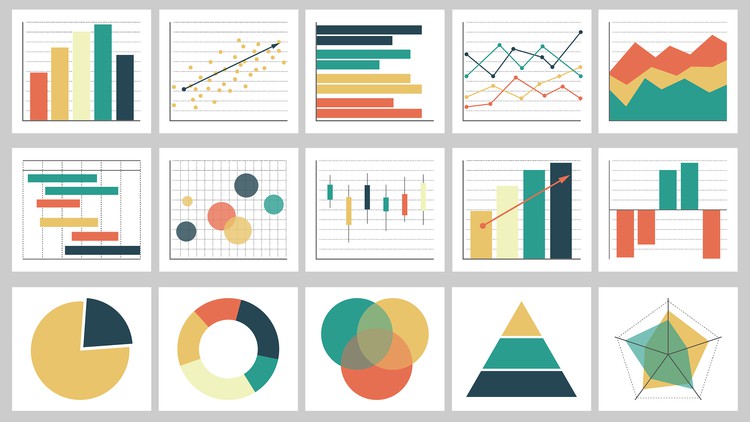
- Create compelling data visualisations.
Our interactive curriculum is designed to cater to both novices and seasoned users, ensuring that you can apply these powerful techniques to real-world scenarios.
Key Topics Covered:
📊 Power Query: Master data transformation with the ultimate tool for data cleaning and shaping.
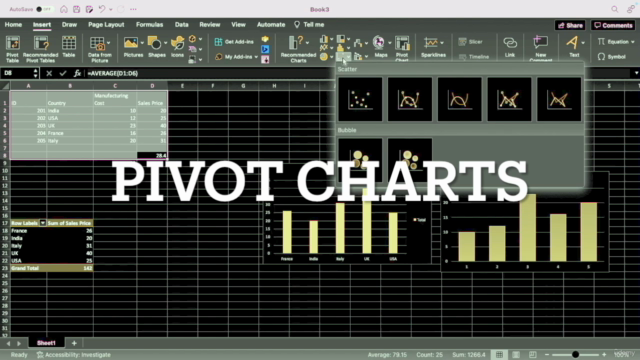
🔢 Pivot Tables and Charts: Learn how to summarise and analyze large datasets efficiently and visually.
🧠 Power Pivot: Dive into data model creation and complex data analysis.
📈 Excel Dashboards: Craft dynamic reports that provide real-time insights and data visualisation.
🔱 Forecasting: Predict future trends with advanced forecasting techniques.
❓ What-If Analysis: Make informed decisions using scenario, goal seek, and data tables.
🎲 Solver: Explore what's possible with optimization problems and solve them effectively.
📈 Descriptive Statistics: Summarize your data with mean, median, mode, and more!
🔁 Correlation Analysis: Understand relationships between variables to make better decisions.
📊 Regression Analysis: Predict future outcomes using historical data.
Capstone Project:
Apply your newly acquired skills to a real-world dataset from an apple refurbished product seller, provided by the course instructor. You will:
- Import and format data using Power Query.
- Generate insightful pivot charts.
- Create a comprehensive Excel Dashboard.
- Submit your dashboard for review, showcasing your ability to present complex data in an easily digestible format.
What You'll Gain:
- A deep understanding of Excel's advanced BI tools.
- Practical experience with real-world datasets.
- The confidence to analyze, interpret, and visualize data like a pro.
- A certificate of completion from a certified expert in Business Intelligence and Data Visualisation.
Join us now and turn your data into stories that drive business success! 🚀
Enrol Now and Transform Your Career with Advanced Excel Skills! 📈✨
Course Gallery


Loading charts...